Google Analytics 4 Implementation Guide - Step 4 - Navigating the tool

In the first three steps, we covered where to start GA4 implementations, which involved the broader team and defining and aligning on goals. We then moved to data tracking, where we discussed the how; in our third step, we discussed GA4 settings, their meaning, and how to configure them.
Assuming we have completed the steps above, it's time to navigate the GA4.
Why is this post important?
If you find navigating in GA4 somewhat cumbersome and need help, you can look at these posts and find practical suggestions in this one. I'll walk you through the default UI, dive into all main sections, show suggested configurations, and then move to custom reports to show what you can do in GA4 more than readily available.
What can you accomplish by the end of this post?
You can quickly navigate the tool, change the UI according to your needs, and do custom advanced analysis.
GA4 UI Breakdown
Navigation Structure
GA4 welcomes us with a tiered navigation menu. The first shows four options: Home, Reports, Explore, and Advertising. As you engage with these options, the second tier is shown. Let's quickly take a look at them.
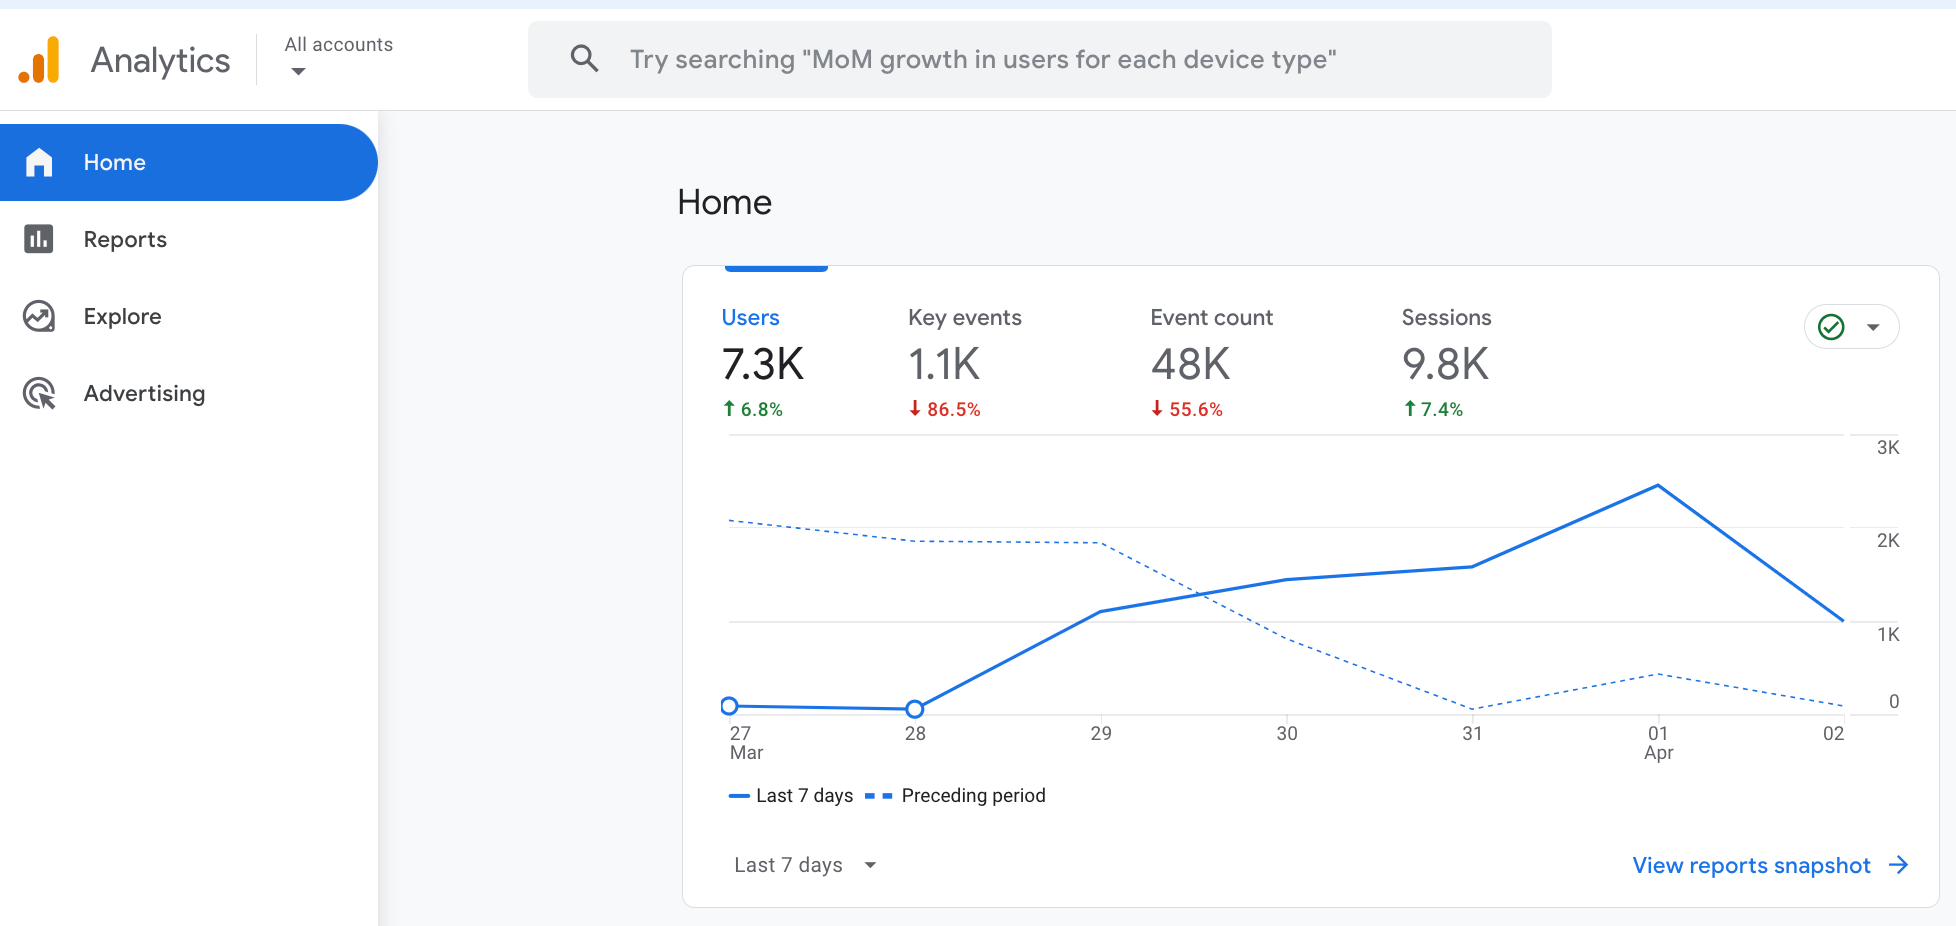
Home Section
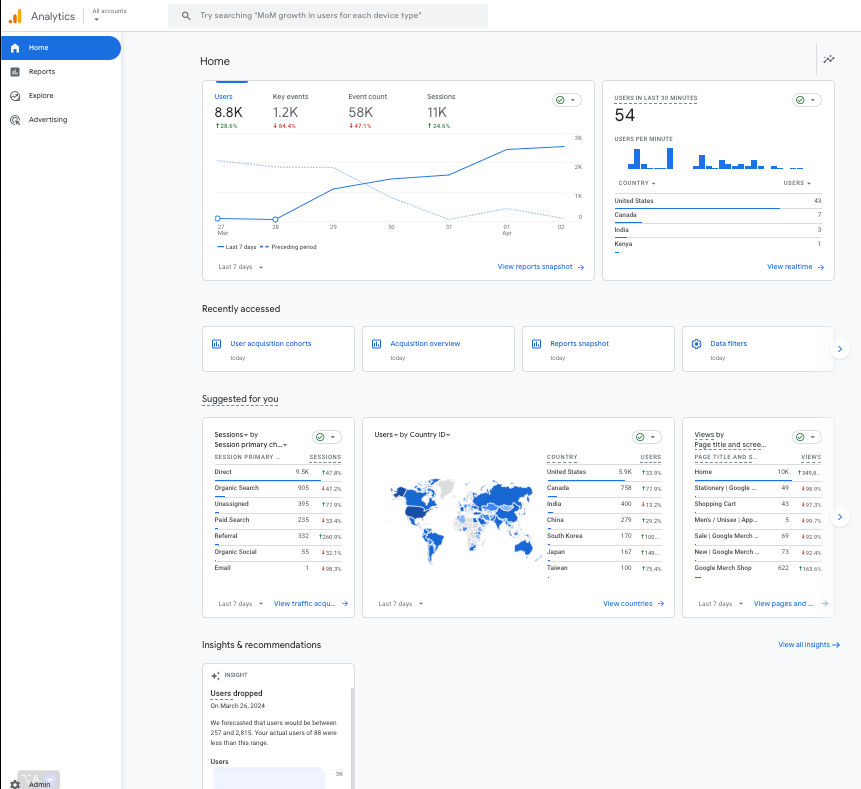
The home screen provides a quick overview, where you can personalize the selected metrics in the top section. It also provides a summary of real-time, where you can quickly filter the visitors from the last 30 minutes by their location, audience group, acquisition campaigns, etc.
Below are the reports you recently accessed; if you wish to go to the report more frequently, it can be helpful. The Suggested for You section offers a slider of the most popular cards across all GA4 properties and personalized suggestions. As a rule of thumb, if you see a dropdown icon in these cards, it indicates that you can play with it. For example, the first card in the suggested for you section below has Sessions by Session Primary Channel Group, where you can change both and dive into the session campaign.
The last part of the home report is the "Insights and recommendations" reports you have accessed, insights & suggestions. As the screenshot below shows, GA4 has automatically detected a decrease in user count lately and shared this finding here.
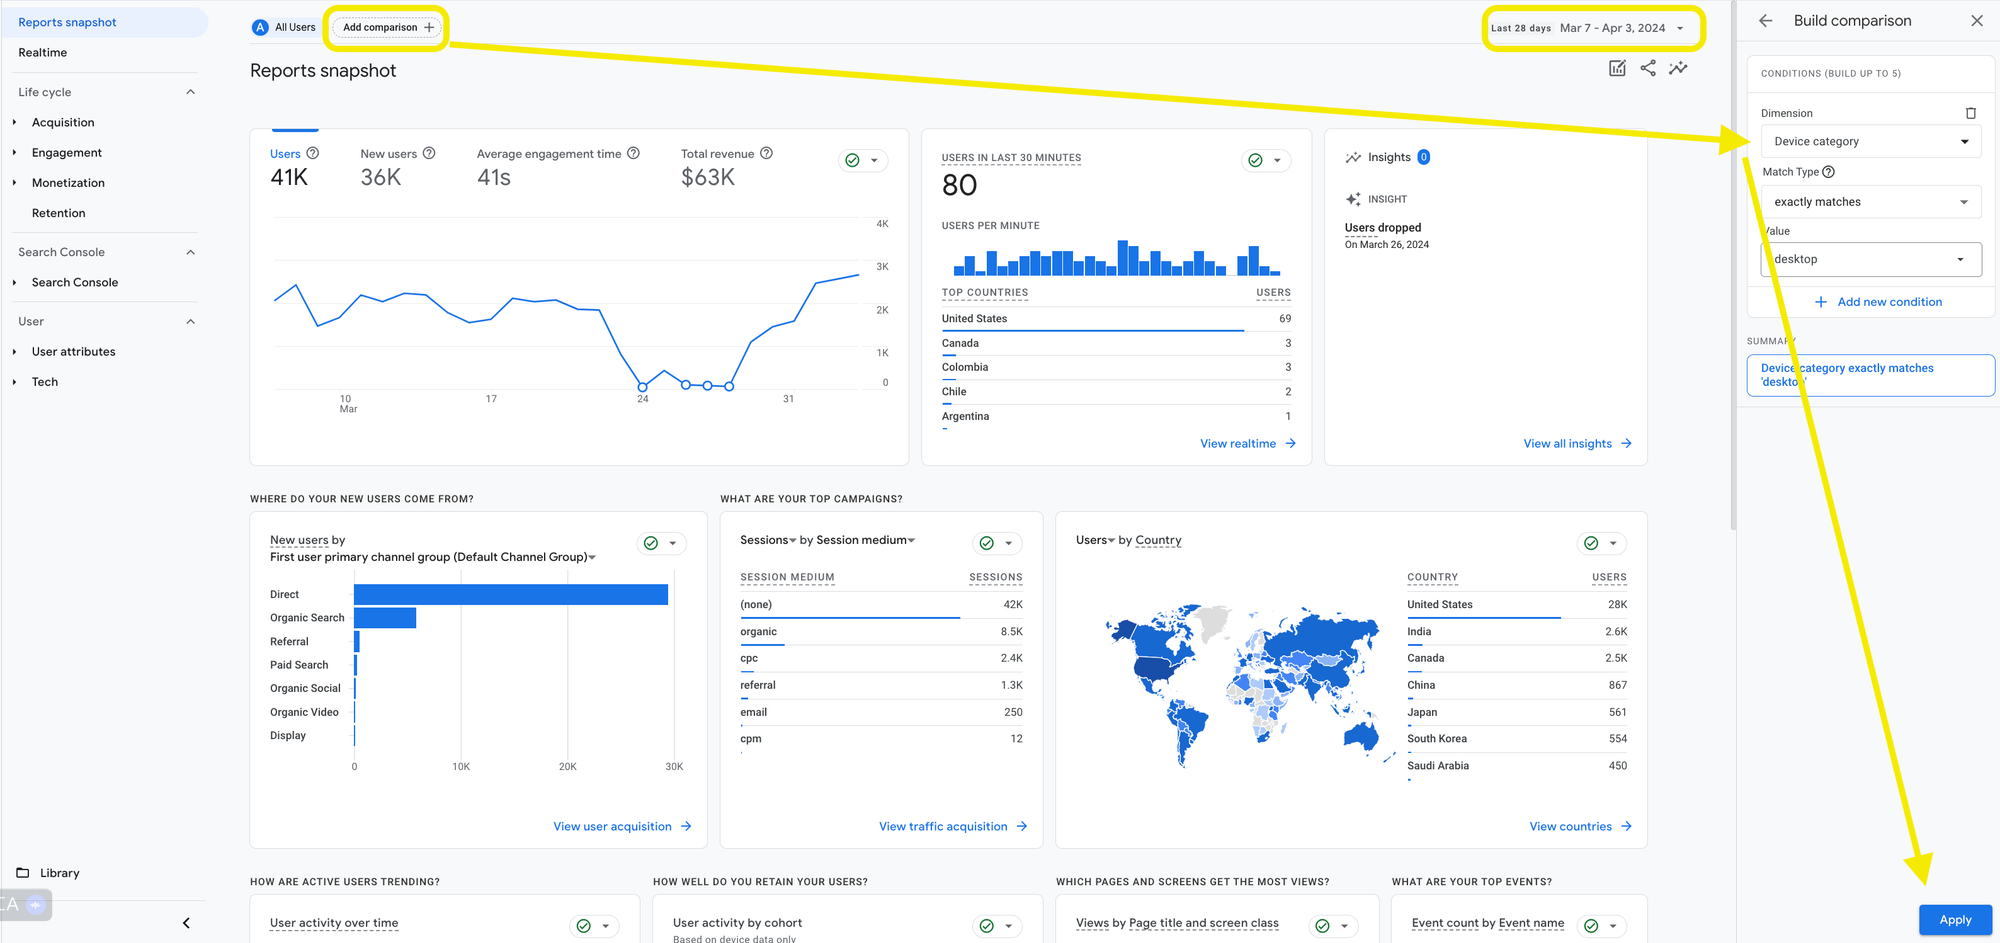
Reports Section
Like the Home screen, the Report section welcomes you with an overview report called "Reports Snapshot." As its name suggests, this page contains many reports, where you can click on the "View" buttons to see the details. In this screen, you can also select the period you wish to analyze and add comparisons to your reports. For example, if you wish to compare "desktop" and "mobile" visitors, just prepare two comparisons containing the desired factors.
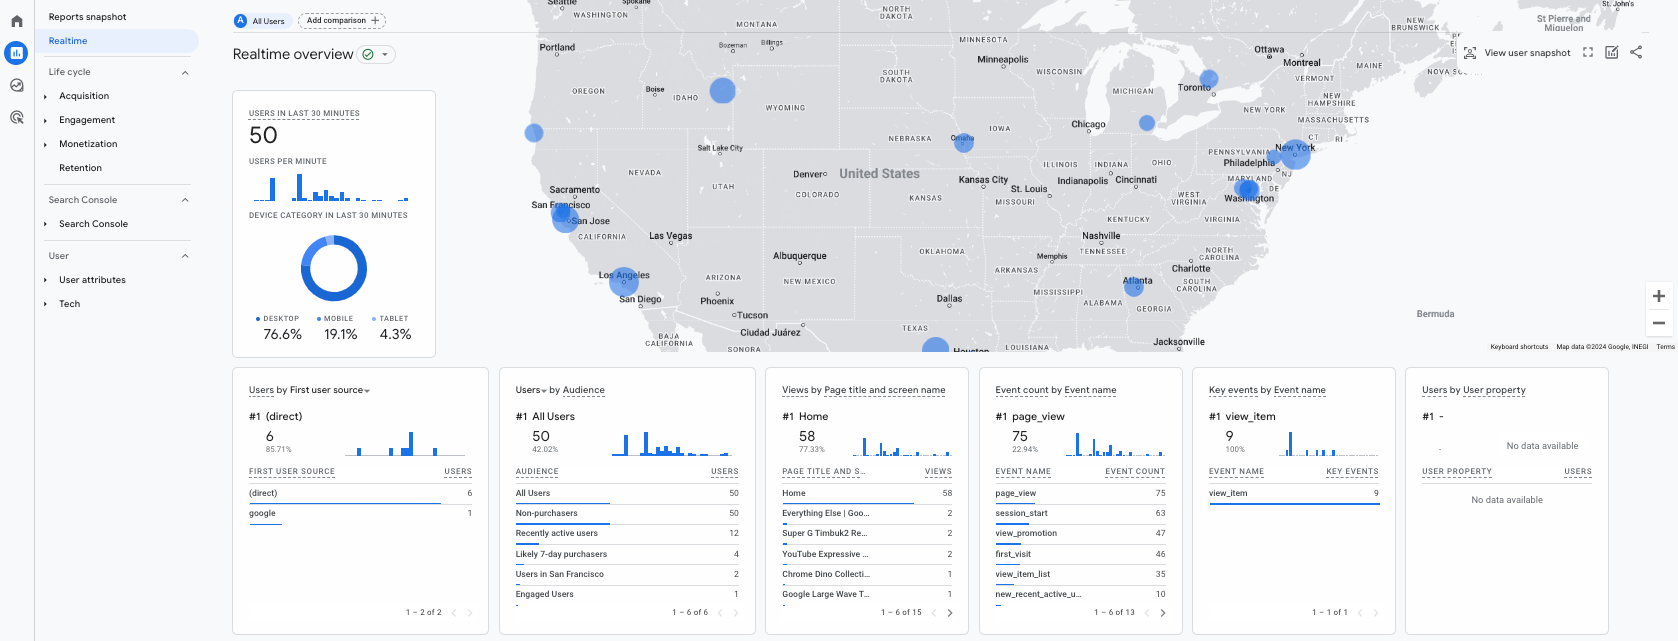
Below "Reports Snapshot," you'll find ReaRealtimeports. It's a fancy-looking report that shows the visitors from the last 30 minutes by location, audience, acquisition source, event, key events they completed, etc. Another nice feature of this page is you can view "a random user's snapshot." You can find it at the top right-hand side.
Life cycle Collection
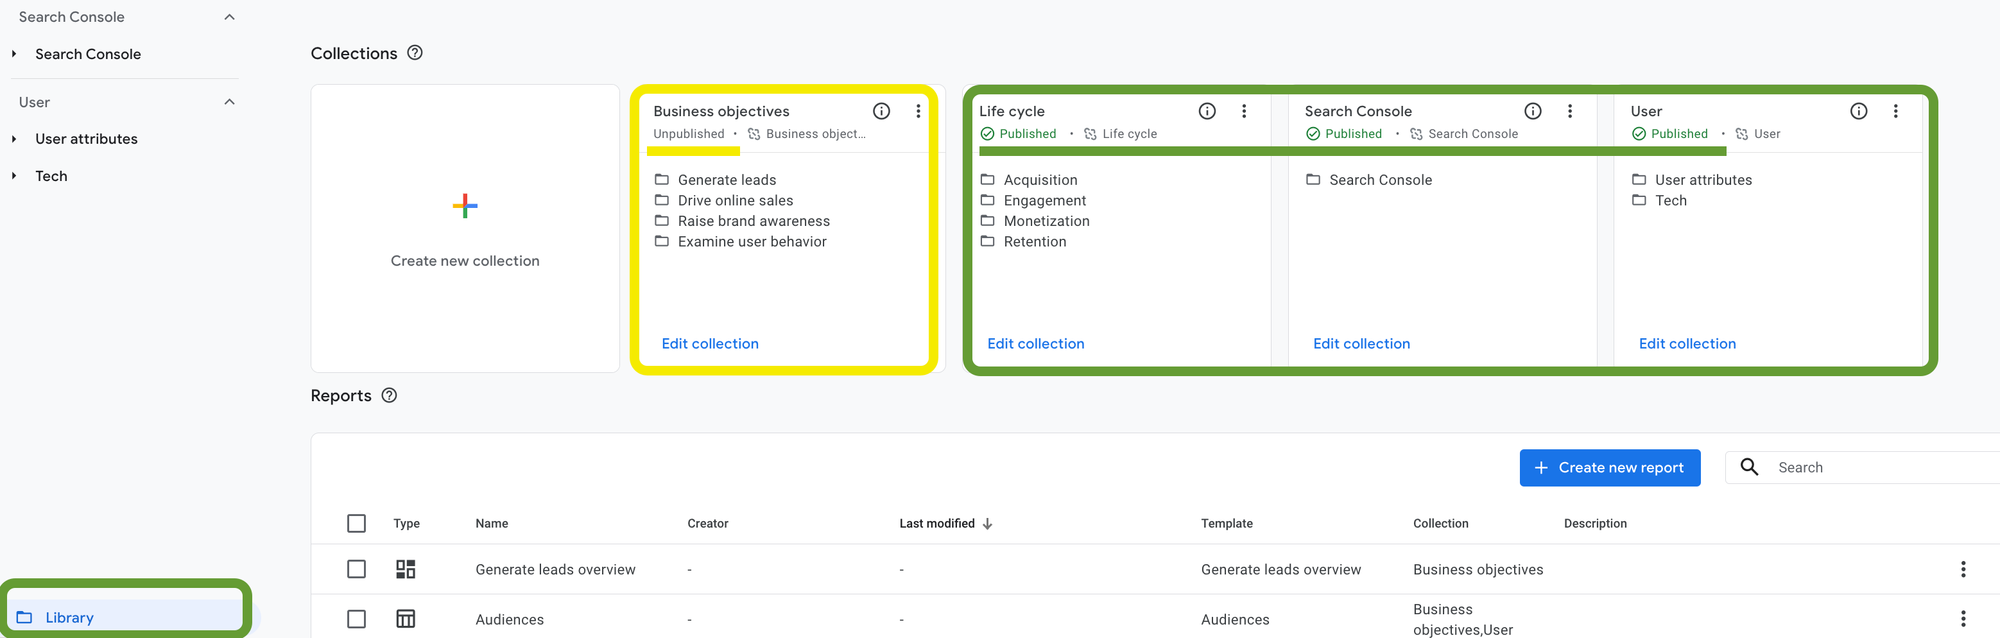
A collection is a group of topics and reports. If your GA4 UI shows a collection different from the "Life cycle," you can visit the "Library" section at the bottom of the second-tier navigation. You can publish or unpublish the collections, create reports, add them to collections, and do more. Therefore, a variety of UIs are expected across different GA4 properties.
Acquisition
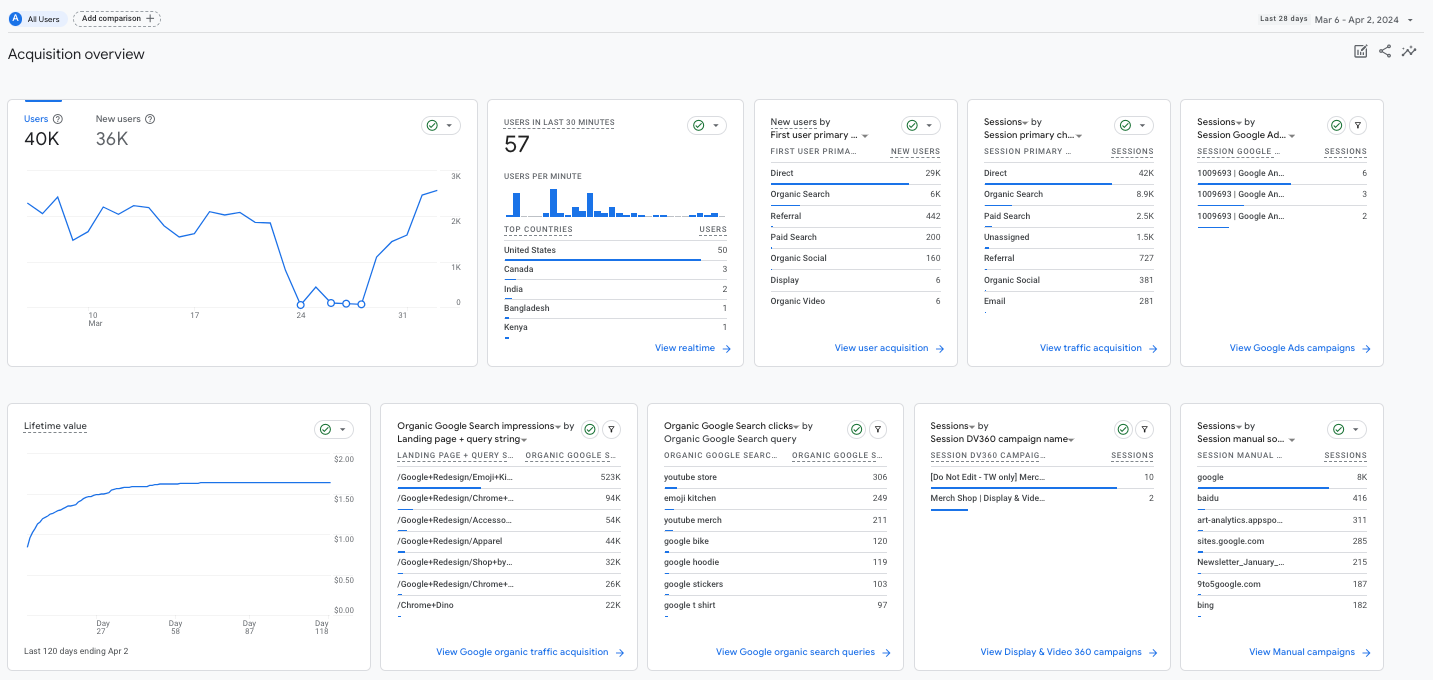
This report helps you understand where your traffic is coming from. It has three reports: one overview and two detailed reports on User Acquisition and Traffic Acquisition.
The overview report below shows many cards discussing Users, New Users, and Sessions in different dimensions. Knowing the difference between Users, New Users, and Sessions can help us digest the summary cards. A new user is defined as the first time they visit our website within the selected date range; below, we can see the last 28 days. All New Users are also Users, but not all Users are New Users. Simple logic :) A user can visit our website multiple times; therefore, the expected metrics by size happen as follows;
Sessions > Users > New Users
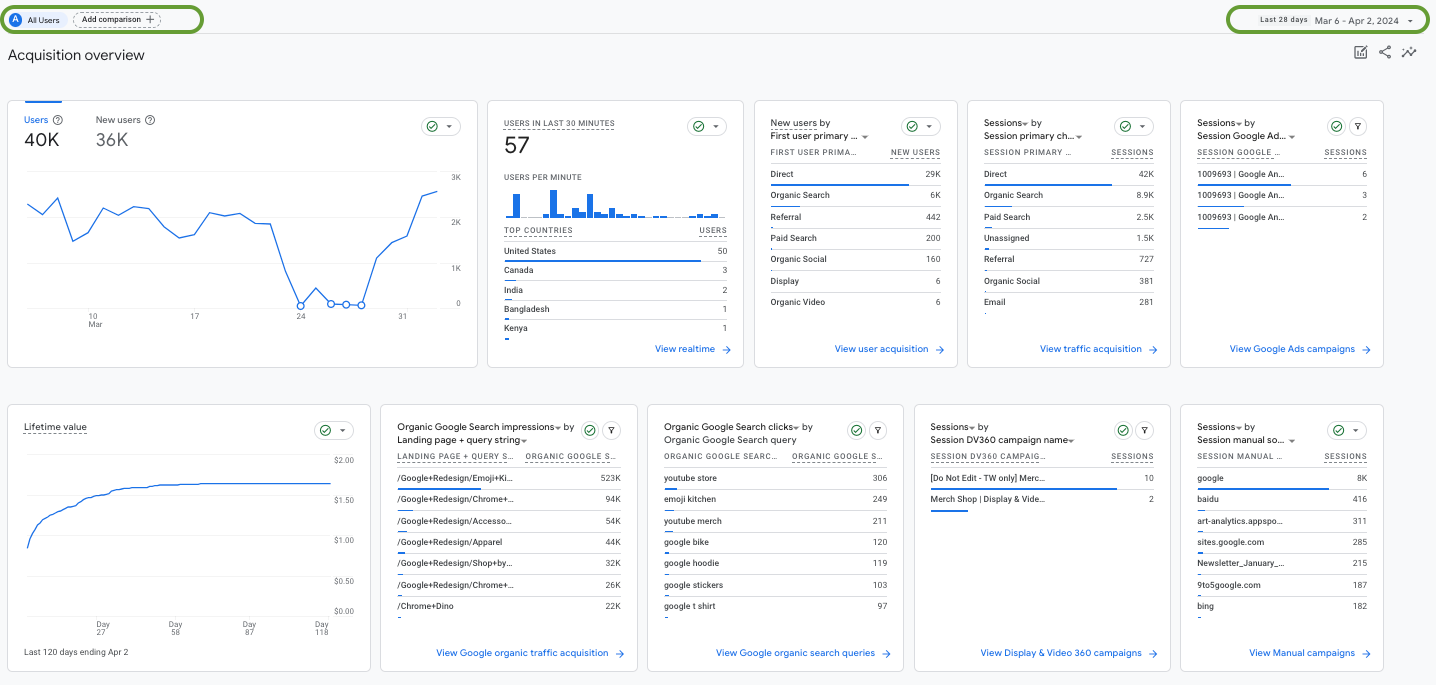
In these Acquisition reports, you can see how the visitors/users arrive at your website. GA4 uses "UTMs" to classify how these visitors find our links -they can find our links in various places: Social Media, Email, Google searches, paid ads, and many more ways to be discovered. Google has an excellent way of categorizing and assigning these sources to related channels. Then, we can analyze the acquisition sources to determine where we should invest our time, effort, and budget; we want to find the mediums that bring the best visitors to our website. To do that, we need to have a solid UTM structure in place, which will help us distinguish our traffic acquisition efforts, and eventually, we can analyze, compare, and take action by learning.
Here are a few sources to help you understand how GA4 classifies the channels and how you can create URLs with UTMs for your marketing efforts.
Engagement
This report shows what visitors do on your website—the pages they land on, the other pages they visit, the events they engage with, whether they come back, and more.
The overview report provides a summary of all engagements. You can click on the cards to see the details, and then you can dive deeper to analyze them.
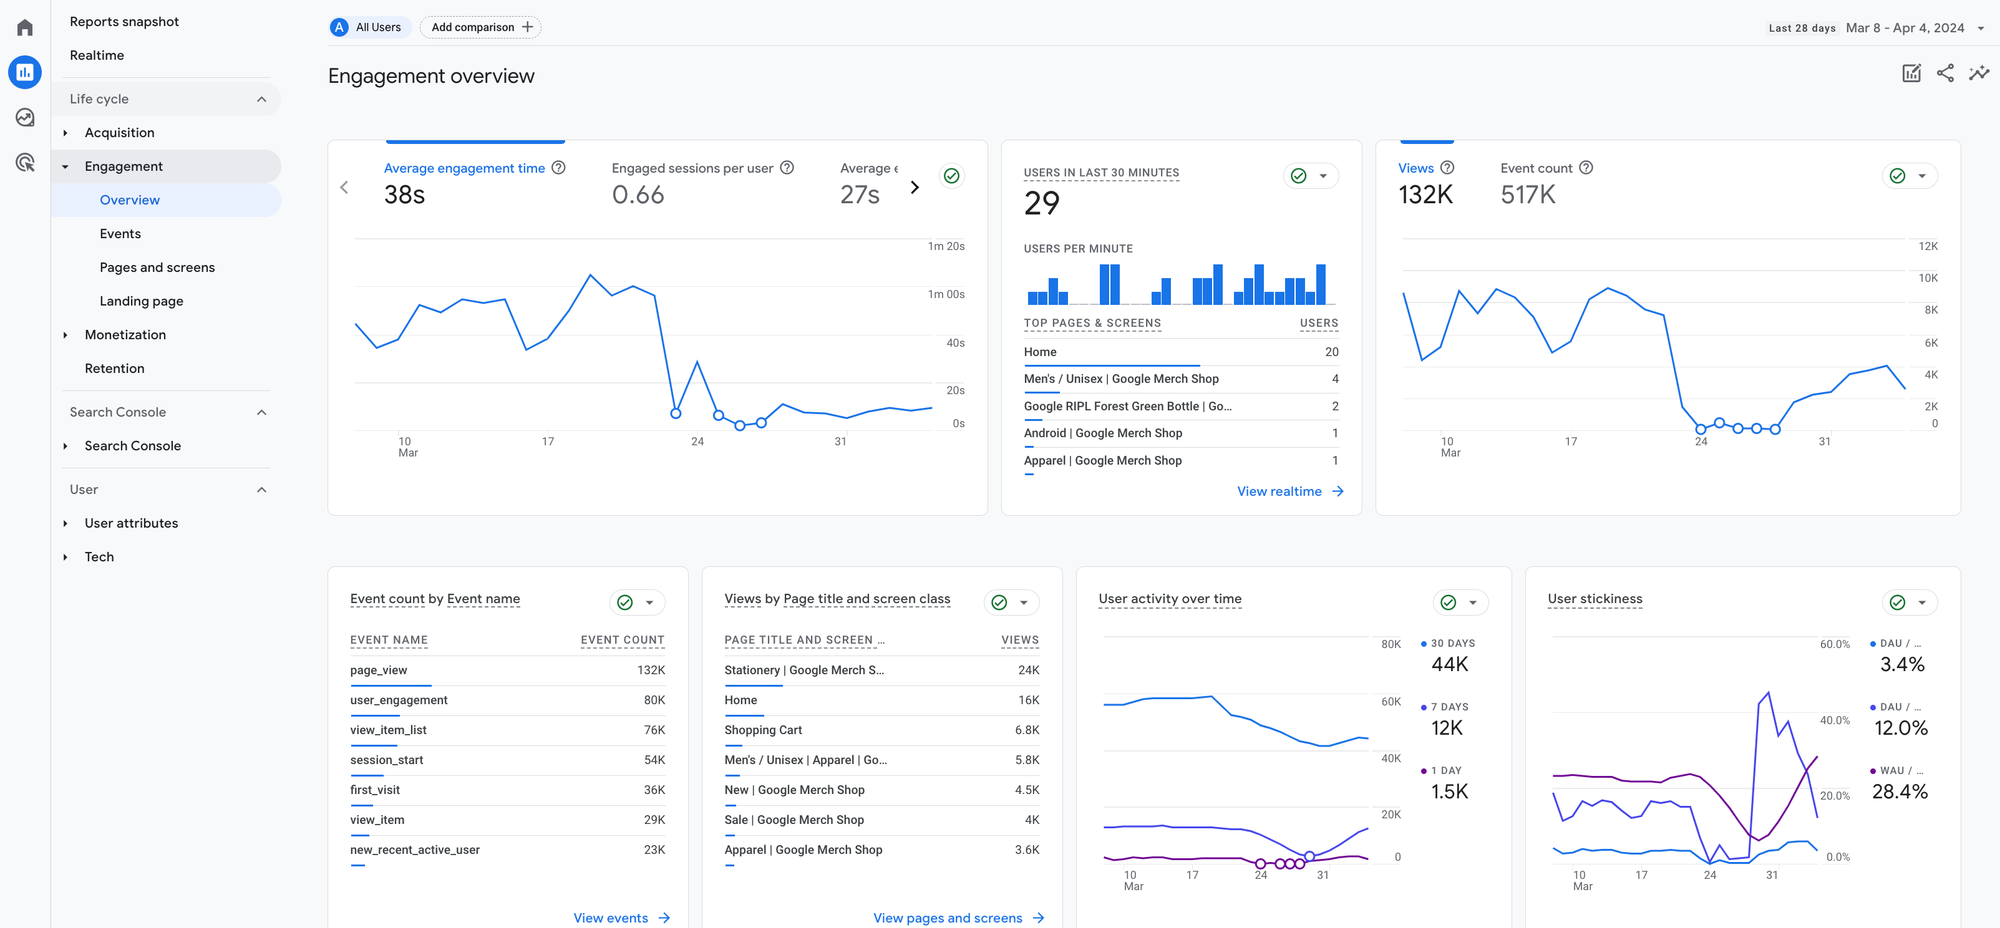
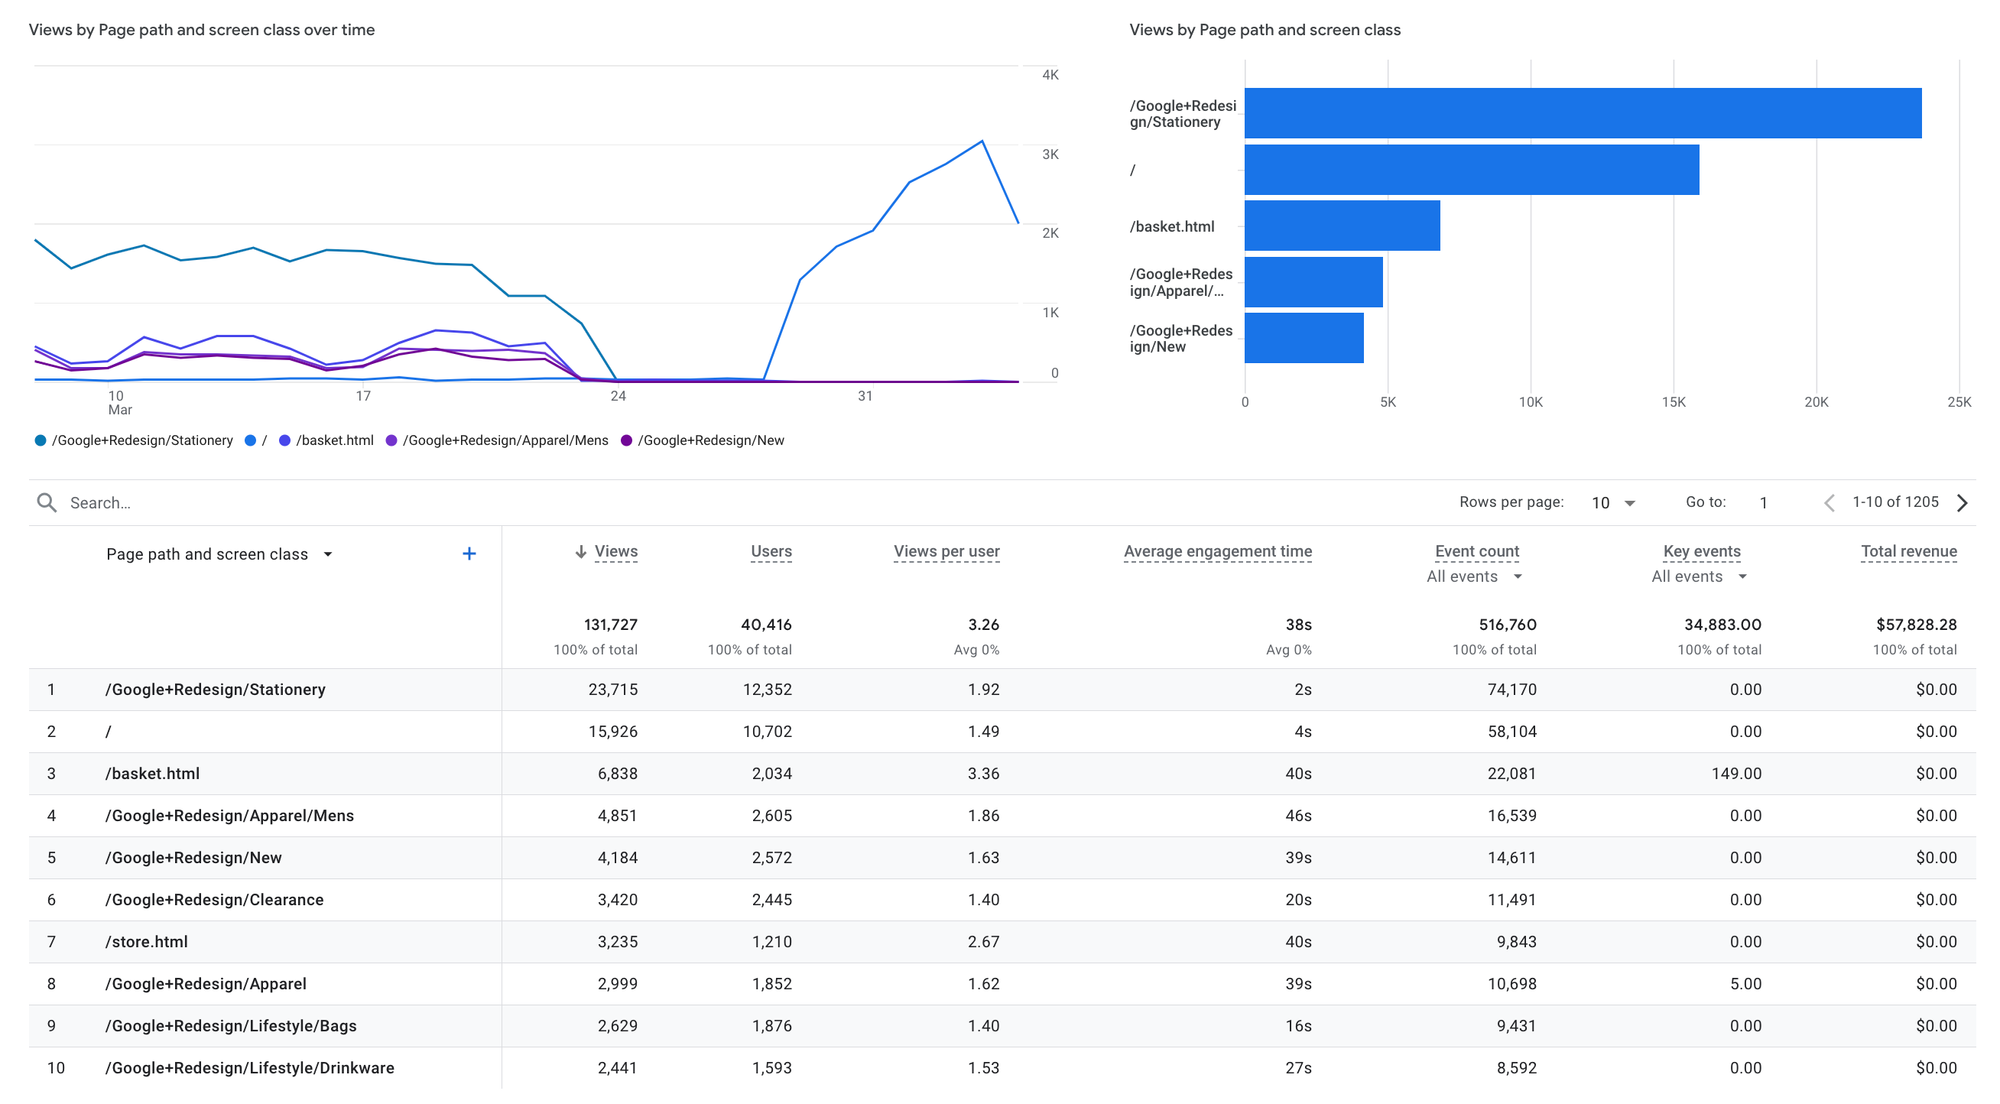
For example, you can click the "View pages and screens" button to take you to the following screen. You can sort the pages by relevant dimensions, see how many visitors engage with a specific page, how many times they visit the page on average, how long they engage with it, etc.
Here, the /basket page is viewed 3.36 times per visitor. Well, it's not easy to decide what to purchase, right?
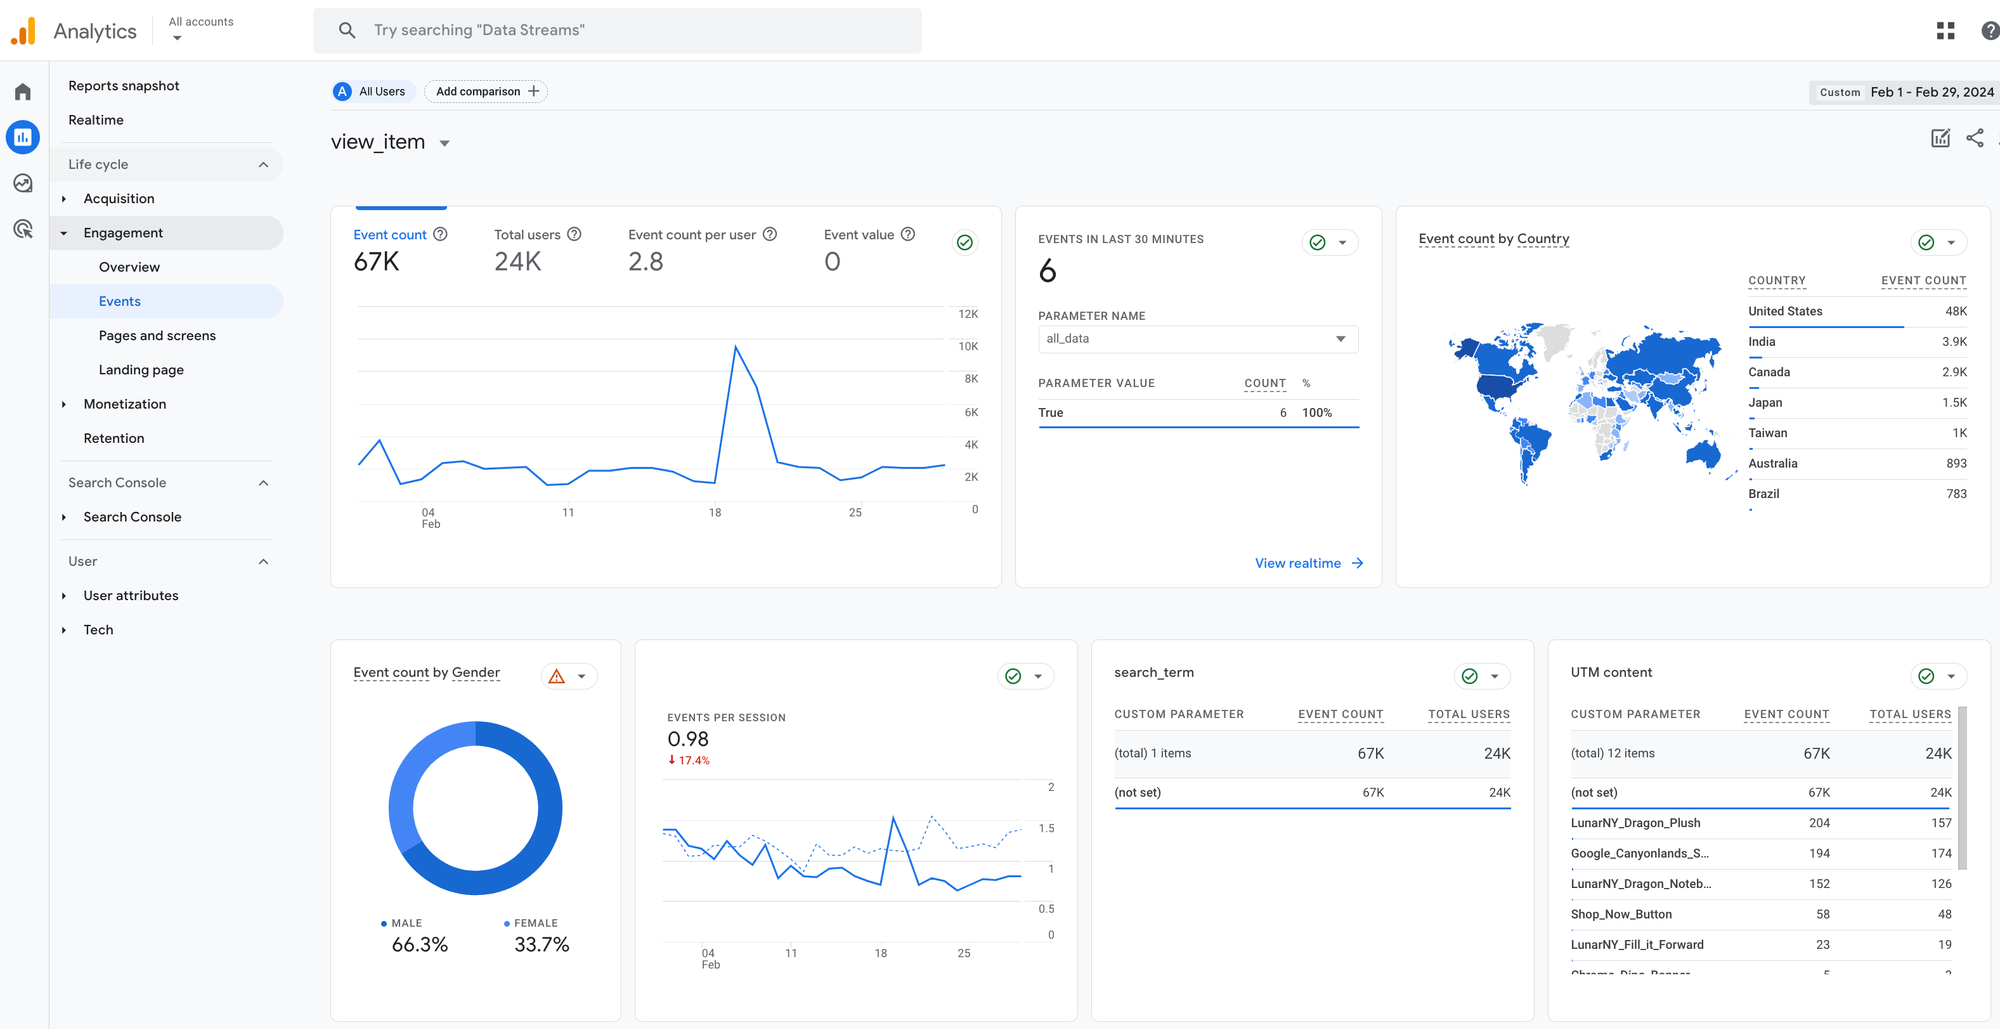
Another critical report in the engagement section is the Events tab. You can see the events and click on them to delve one more step deeper.
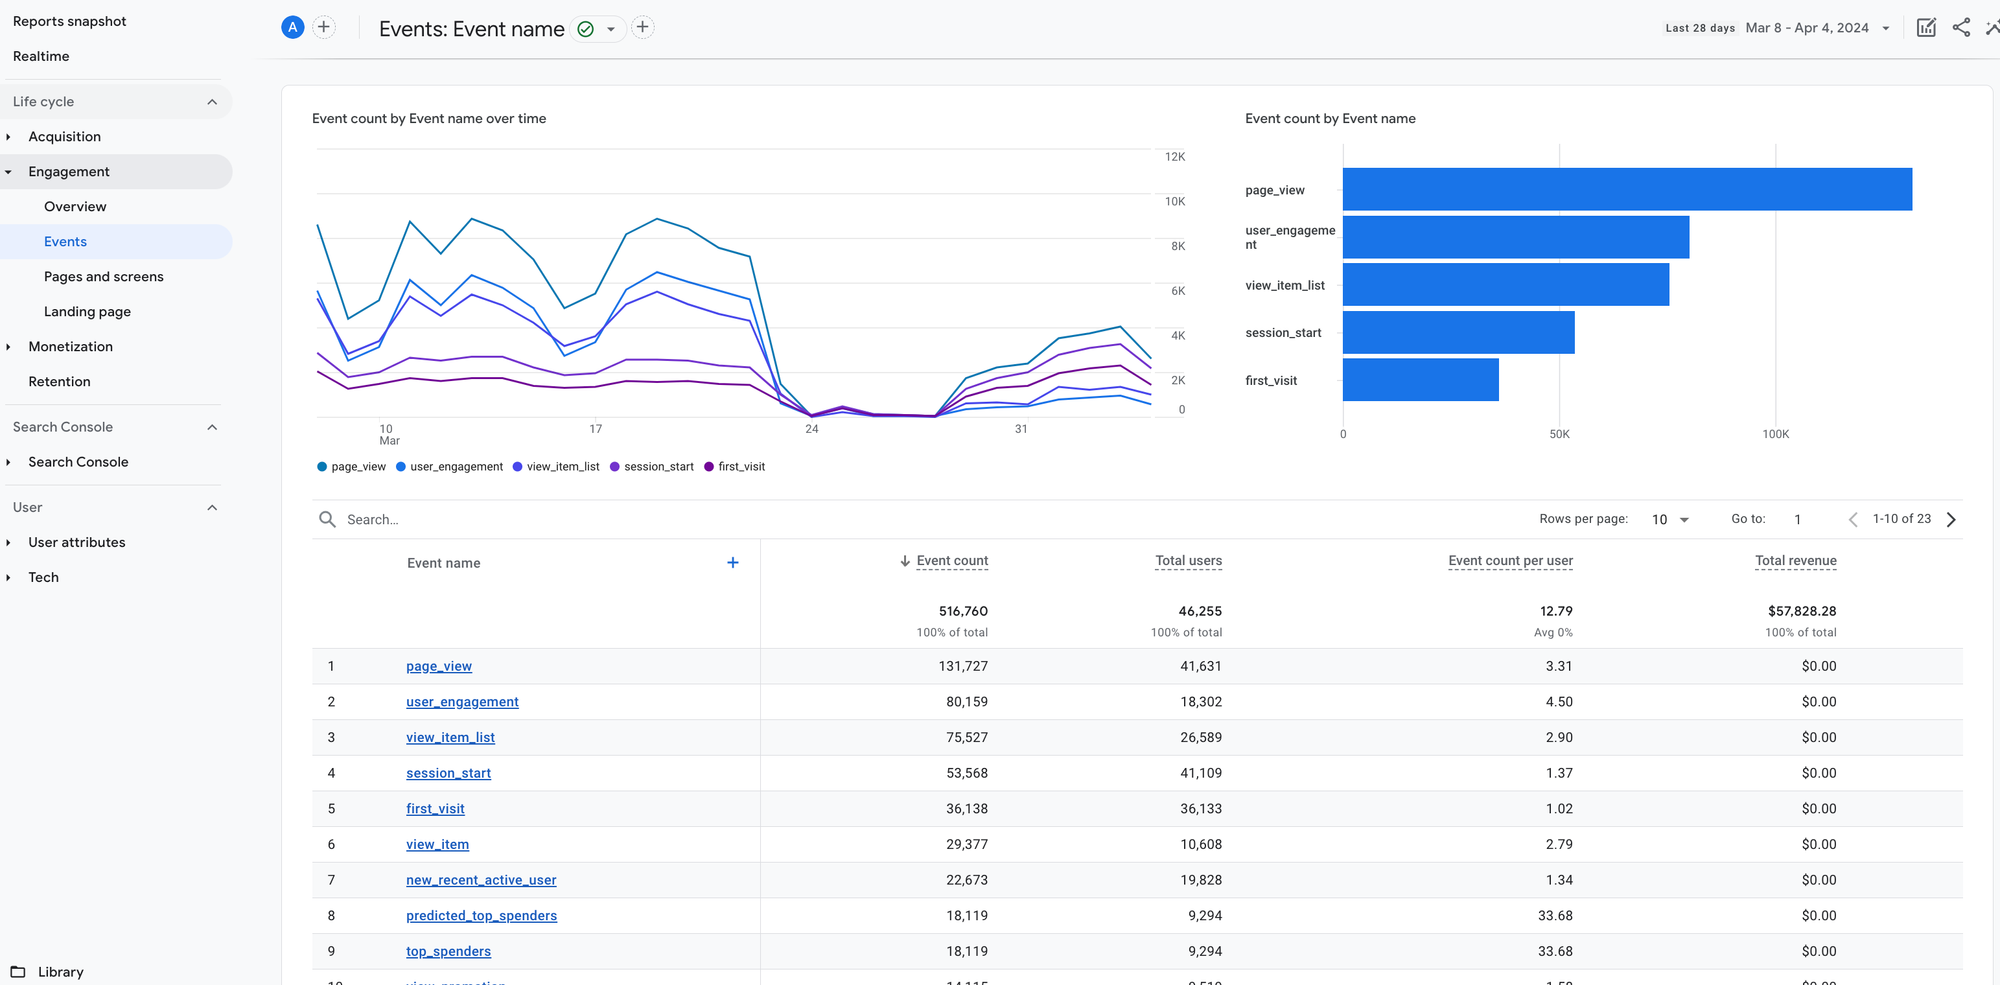
Let's try the view_item event. Here, we can see that this event was used 67K times by 24K users—visitors who engage with a product check 2.8 products on average, etc.
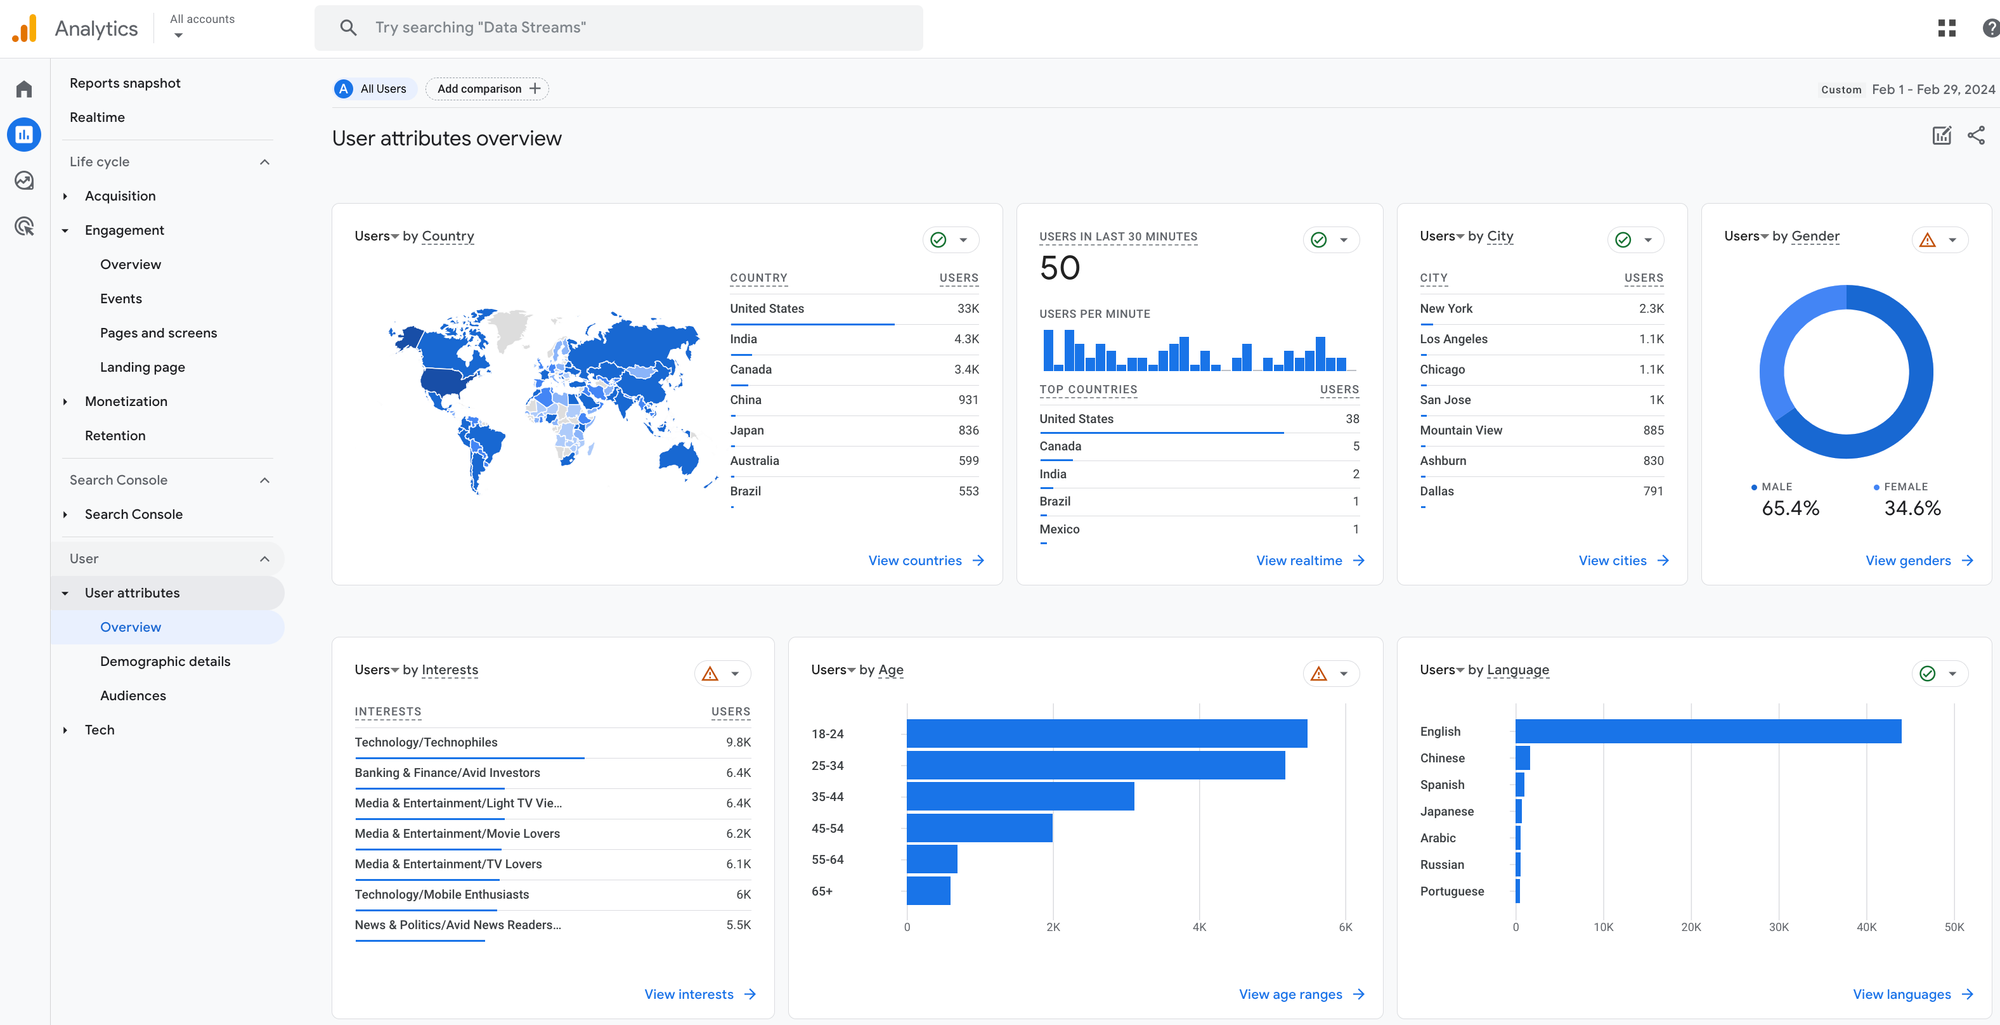
User Collection
This collection shows where visitors are coming from, their demographics, and the technologies (devices, operating systems, browsers, etc.) they use to visit our website.
User Attributes
User reports can help you better understand your target persona. I've seen many cases where the brand targets younger demographics, but older visitors convert significantly better. Such findings, with further tests and understanding, can help you shift your marketing strategies.
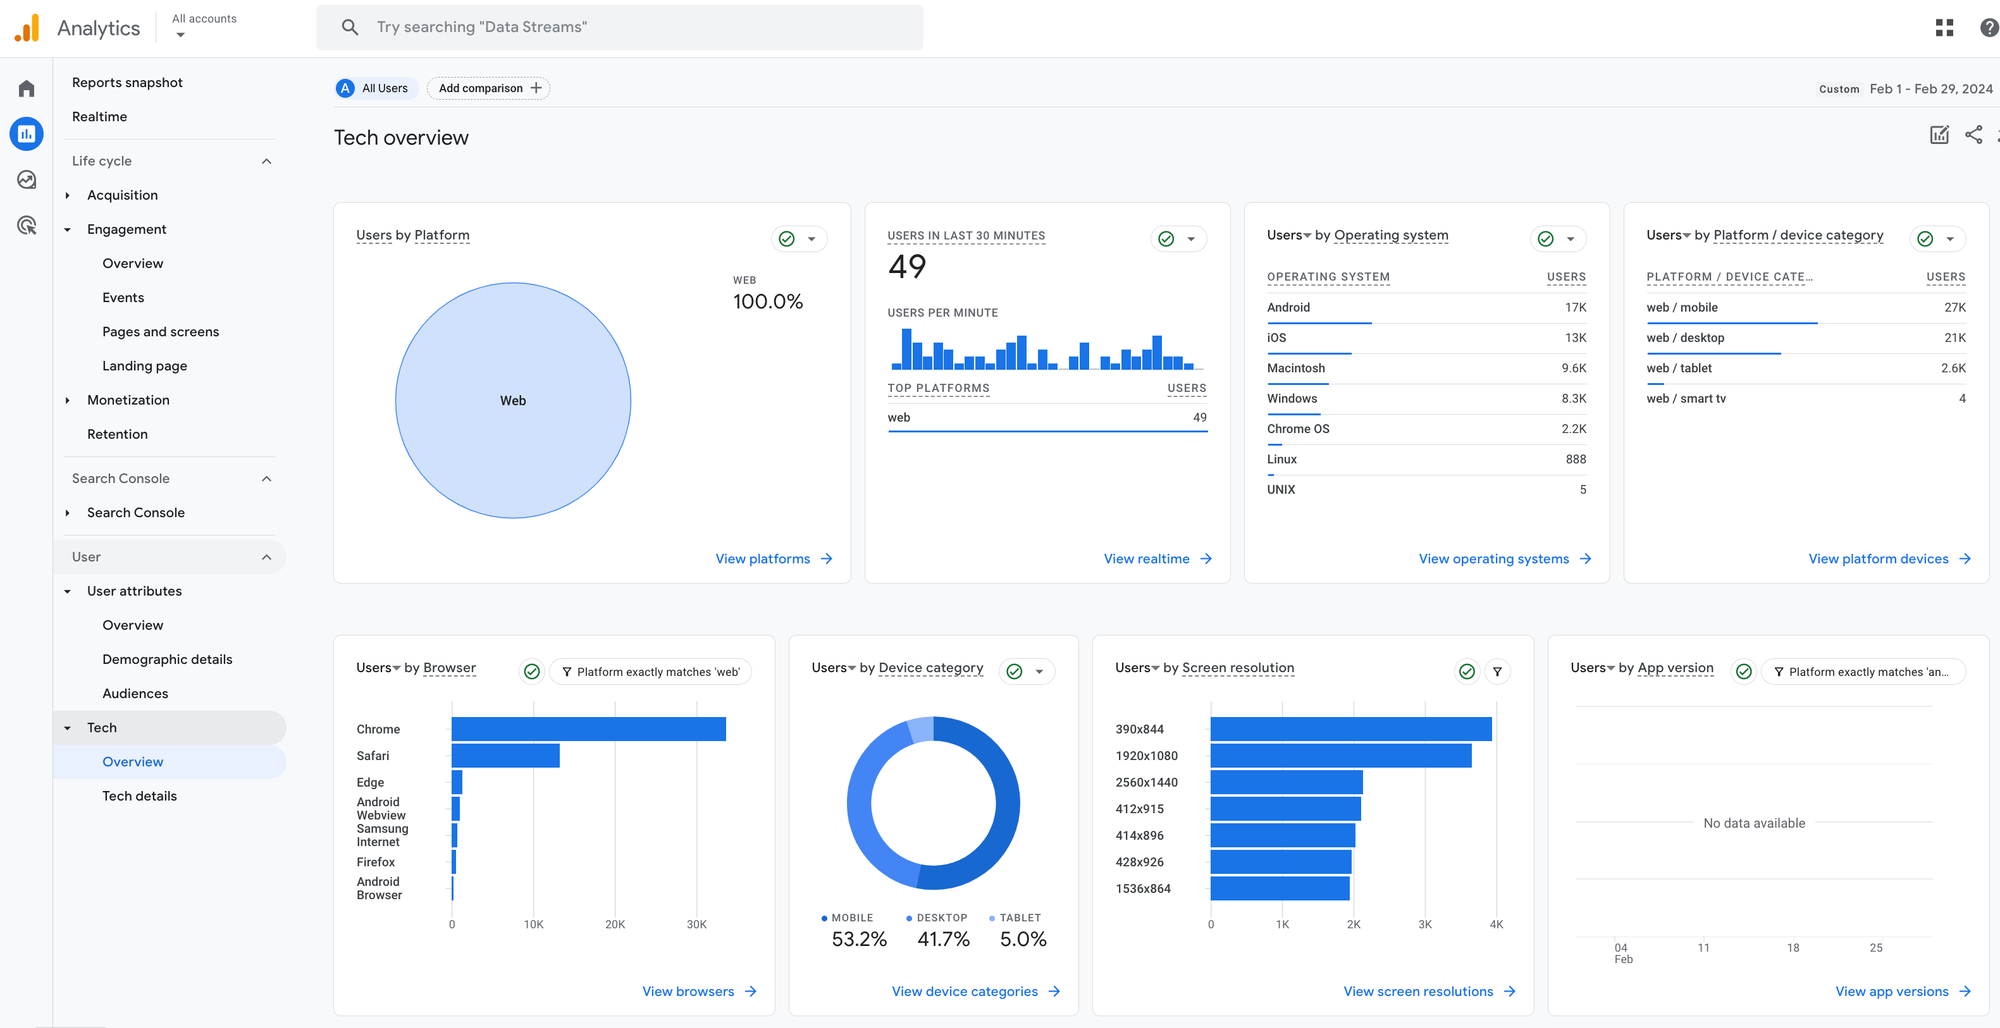
Tech
You can use these reports to determine whether different technologies impact your website's success differently. Maybe mobile visitors convert better, or certain browser users can't engage with your website.
Others
There are other collections in the UI; I plan to cover them separately. Here, I want to add summaries; in the future, I can add links to their posts.
Search Console Collection
Search Console is another Google product that helps you understand what keywords and phrases your visitors search before arriving at your website or your website links listed as results through Google searches. You can use Search Console as a standalone product and connect it with GA4 to gain more benefits.
Explore Section
Built-in reports are for every business. They give a great starting point; however, the more custom implementations and marketing activities you have, the more complex things will get. Segmentations, overlap reports, cohorts, etc., can be discovered using advanced explore reports.
Advertising Section
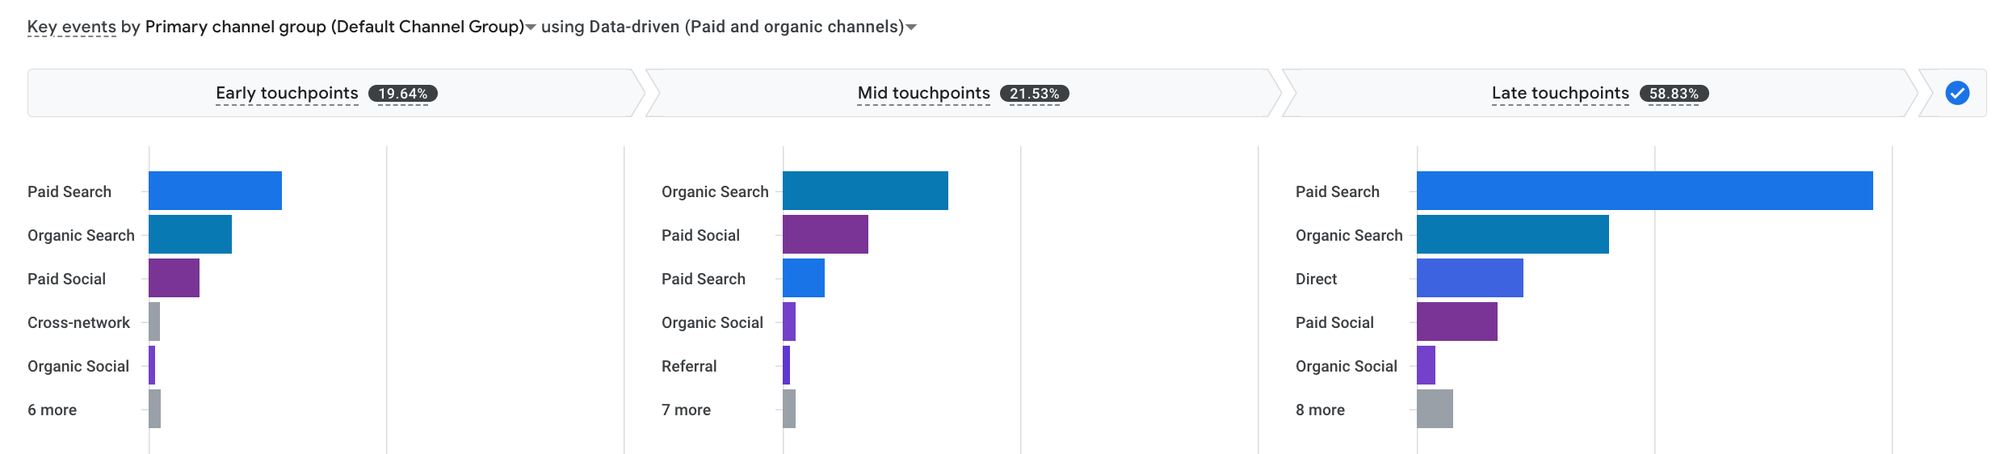
After connecting your Google Ads account, you can see Advertising conversion performances, including attribution paths, model comparisons, and more.
Conclusion
Navigating the tool gives you the needed practice to discover growth opportunities. Do not hesitate to play with the UI, filters, and reports. Lastly, while looking for insights, instead of visiting each and reporting, start with the questions first. What business problems do you want to answer? Ask yourself if the collected data is enough to answer the question, then find the most appropriate way to answer your questions to either validate or reject your hypothesis or hunches.
If you decide the collected data is insufficient to answer your business questions, first, ask if it's possible to collect the needed data. If it is, check out the first GA4 implementation I published here, "Where to Start with GA4? GA4 Implementation Guide—Step 1," to set the right foot while starting a GA4 implementation cleanly.