Why do you need a dashboard for your GA4 account, and how can you create one?

You want growth. Growth is a process, and you must navigate through it. How would you know if you are heading in the right direction, with all vital components giving health signals? A comprehensive data strategy can help you along this journey. Like a car's dash, a business dashboard can quickly give you summary information -at a glance, you can understand if you are going fast or slow, if you need gas, or if engine oil is leaking.
Data analytics has multiple facets. Many businesses strive to be data-driven or data-led organizations. To be one, you must first collect quality data. Without data collection, you'll be left with gut feelings. Though we should have them, we can't solely rely on them.
As with all good and challenging things, data collection is the first step to becoming a data-driven organization. Moreover, there are prerequisites, such as having a data strategy that identifies the goals, stakeholders, and potential decisions you can make with the help of data analysis. Therefore, collecting data in the right way is only the beginning. You must then analyze your data and tie it up with the context to constantly learn about your visitors.
Learning alone is also not the final step. You must take action and reduce mistakes, yet accept that they will happen. Double down on things that work and consistently learn, apply, and ask new questions. This is a vicious cycle of the framework.
Analyzing your data starts with the goals, questions, and problems you have.
Data analysis takes time and requires literacy in analytics, statistics, and tools. For example, after Google sunsetted Universal Analytics, the whole marketing industry was uncertain. Although I loved GA4 from the beginning, witnessing it is being improved, and I believe that Google will further improve it, as they have been doing for the last three years, it's common to hear complaints. The complaints have my greatest empathy.
Having a dashboard for GA4 eliminates the need for tool literacy to some degree. Also, we know that not all organizations have internal data analytics teams. Yet, they need to analyze their data for obvious reasons: lowering acquisition costs, increasing performances, sales, conversions, and more.
Perfect! Now that we have covered the why and what let's continue with how.
How can one create a dashboard?
There are many ways to create a dashboard. It starts with deciding what tool to use. To answer this question, you must first answer what data sources you plan to use. Connecting Google Analytics, Paid Ads, Organic Search, Paid Search, Google Sheets, and Organic Social tools to a dashboard is a common need.
As with many real-life questions, there are multiple correct answers to a question. You can use a powerful paid BI tool to connect these data sources and create your dashboard (for example, Tableau), or you can use other tools that handle the data collection and fixed or somewhat fixed UIs (for example, Glew), or you can select a free tool, yet requires UI customizations (for example, Looker Studio). I am sure there are more ways to go.
In this example, I will create the dashboard using Google Analytics 4 as the data source and Looker Studio as the platform.
What is Looker Studio?
Looker Studio is a free online data visualization tool for creating and sharing dashboards with your stakeholders. Though it has a paid version, the free one can cover many needs.
What kind of data can you connect?
As of April 4th, 2024, there are 23 native connectors. Since it's a Google product, it synchronizes very well with other Google products, including GA4, Google Ads, Search Console, BigQuery, Google Sheets, and more.
Again, there is no native connection to Paid Social (Facebook, Tiktok, Linkedin, Reddit, etc.), Organic versions of these social channels, or e-commerce platforms Shopify, WooCommerce, Amazon, etc.
That's where partner connectors come into play. On top of the native connectors, there are 912 partner connectors to help you connect your data with the Looker Studio. Of course, they are paid tools, but the costs are lower than those of a paid BI tool.
Let's get started!
You can find Looker Studio here.
Sign in using your Google account and start playing around.
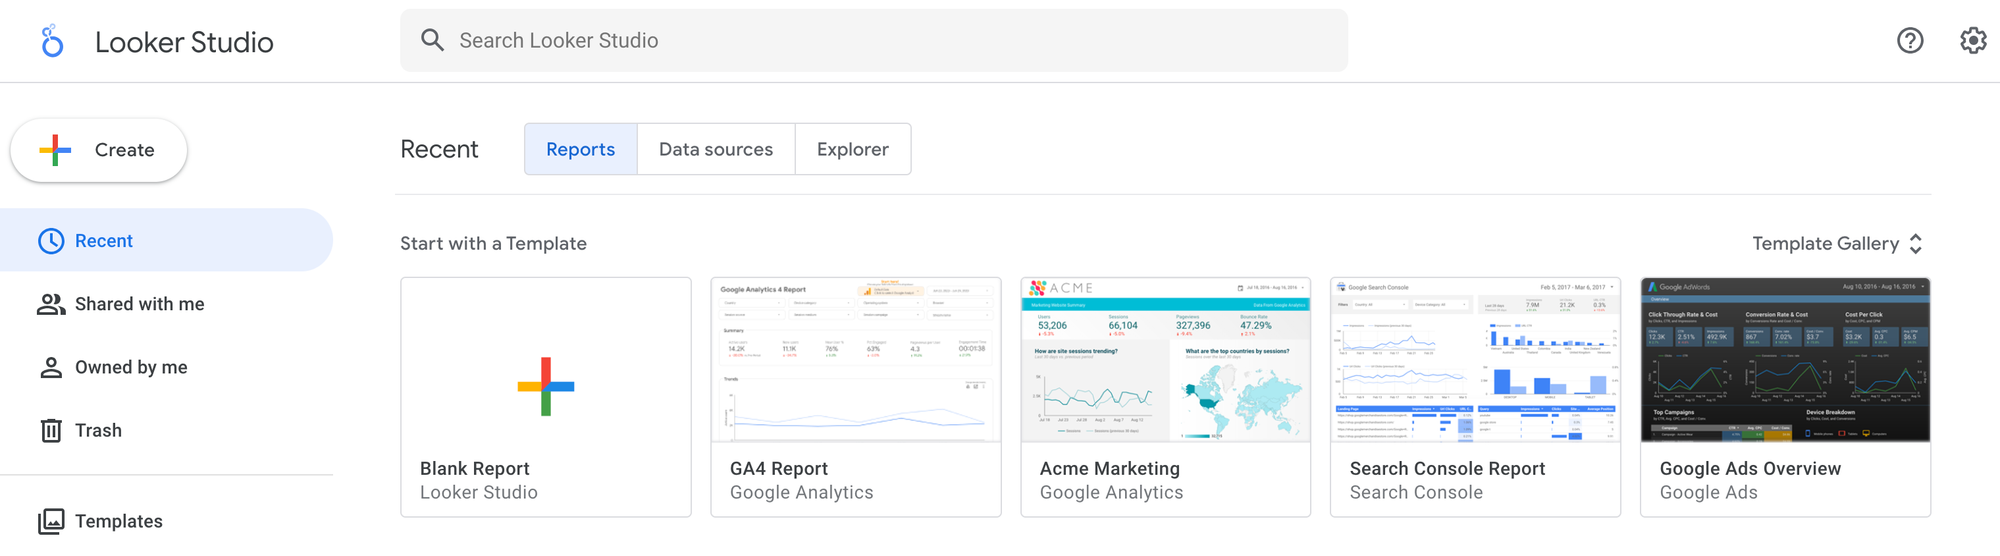
You can start with a Blank Report or use one of the templates.
You can ask yourself multiple questions before jumping into the creation phase. Some of the questions are;
- Who will be the audience for the dashboard?
- What is the goal of the dashboard?
- What data sources are needed?
- What is their dashboard literacy level -beginner, medium, advanced
- How frequently will it be used?
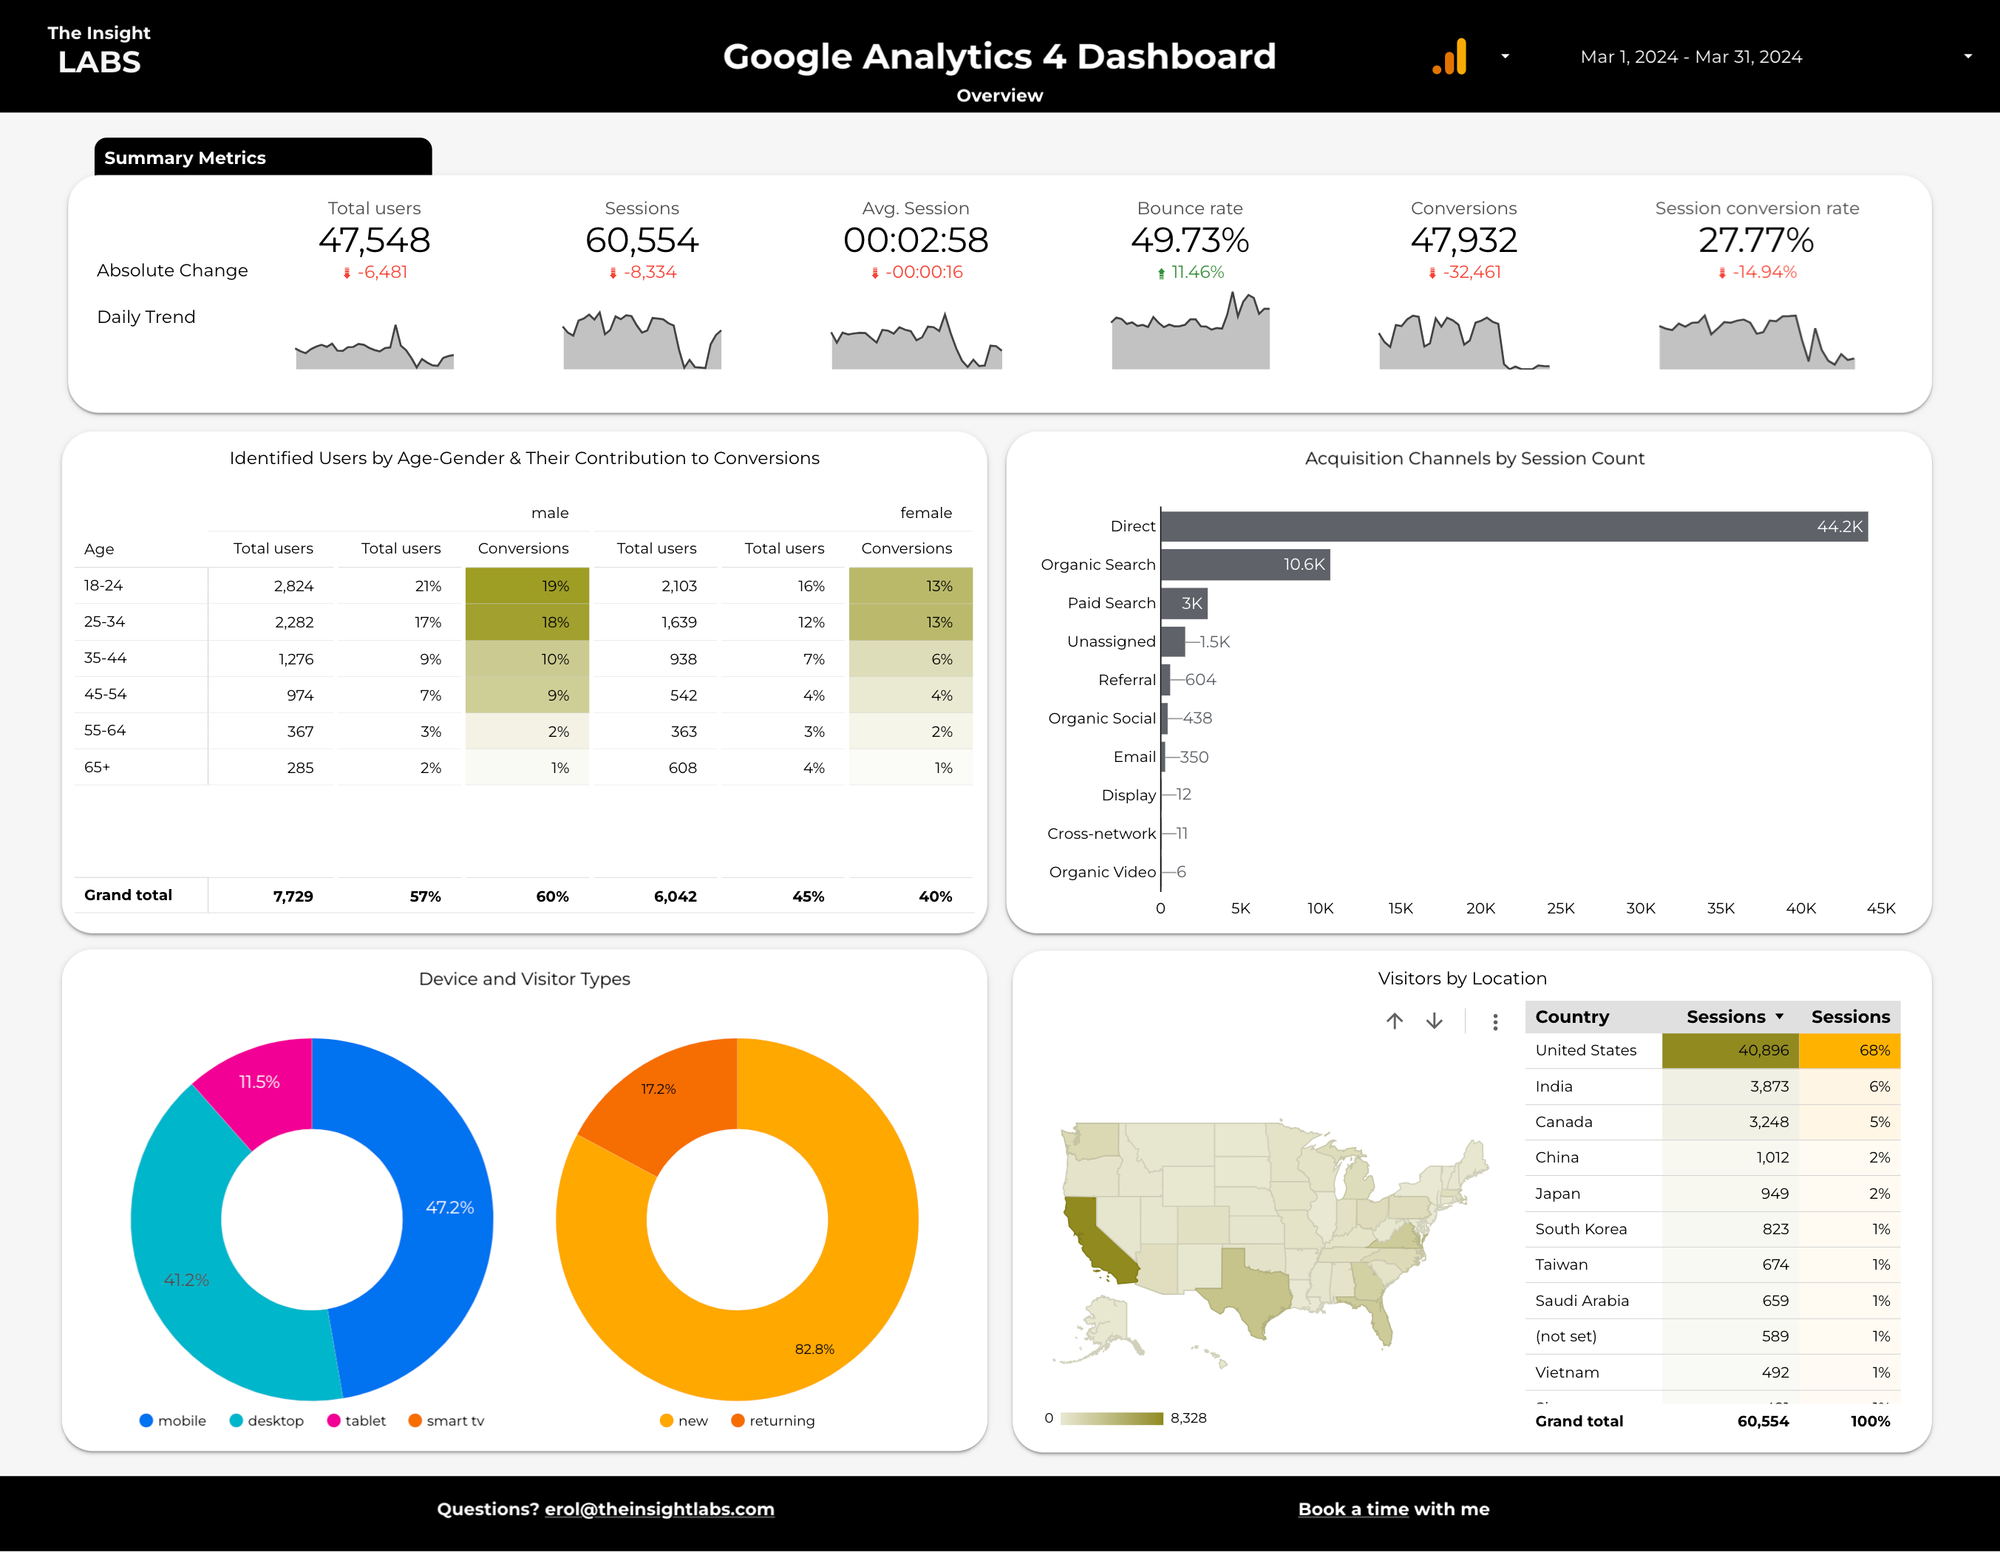
Here, I want to share a dashboard I created for myself. This is a bit of an advanced dashboard. I started building it for personal use. I am actively using it to analyze my clients' data. In time, I can change the layout and functionality, and the screenshot can get outdated, yet the link I will provide will remain up-to-date.
This dashboard has 7 pages. You can have as many as you like.

You can select the date you want to analyze on the top right-hand side. You can use the icon next to the date picker to switch between accounts if you have multiple Google accounts. You can use charts and graphs as filters; by clicking on them, you can filter the rest of the dashboard.
The overview page has summary metrics, which I know most businesses love watching. You can also find demographics and location information, as well as acquisition channels, devices, and user types (new users vs. returning)
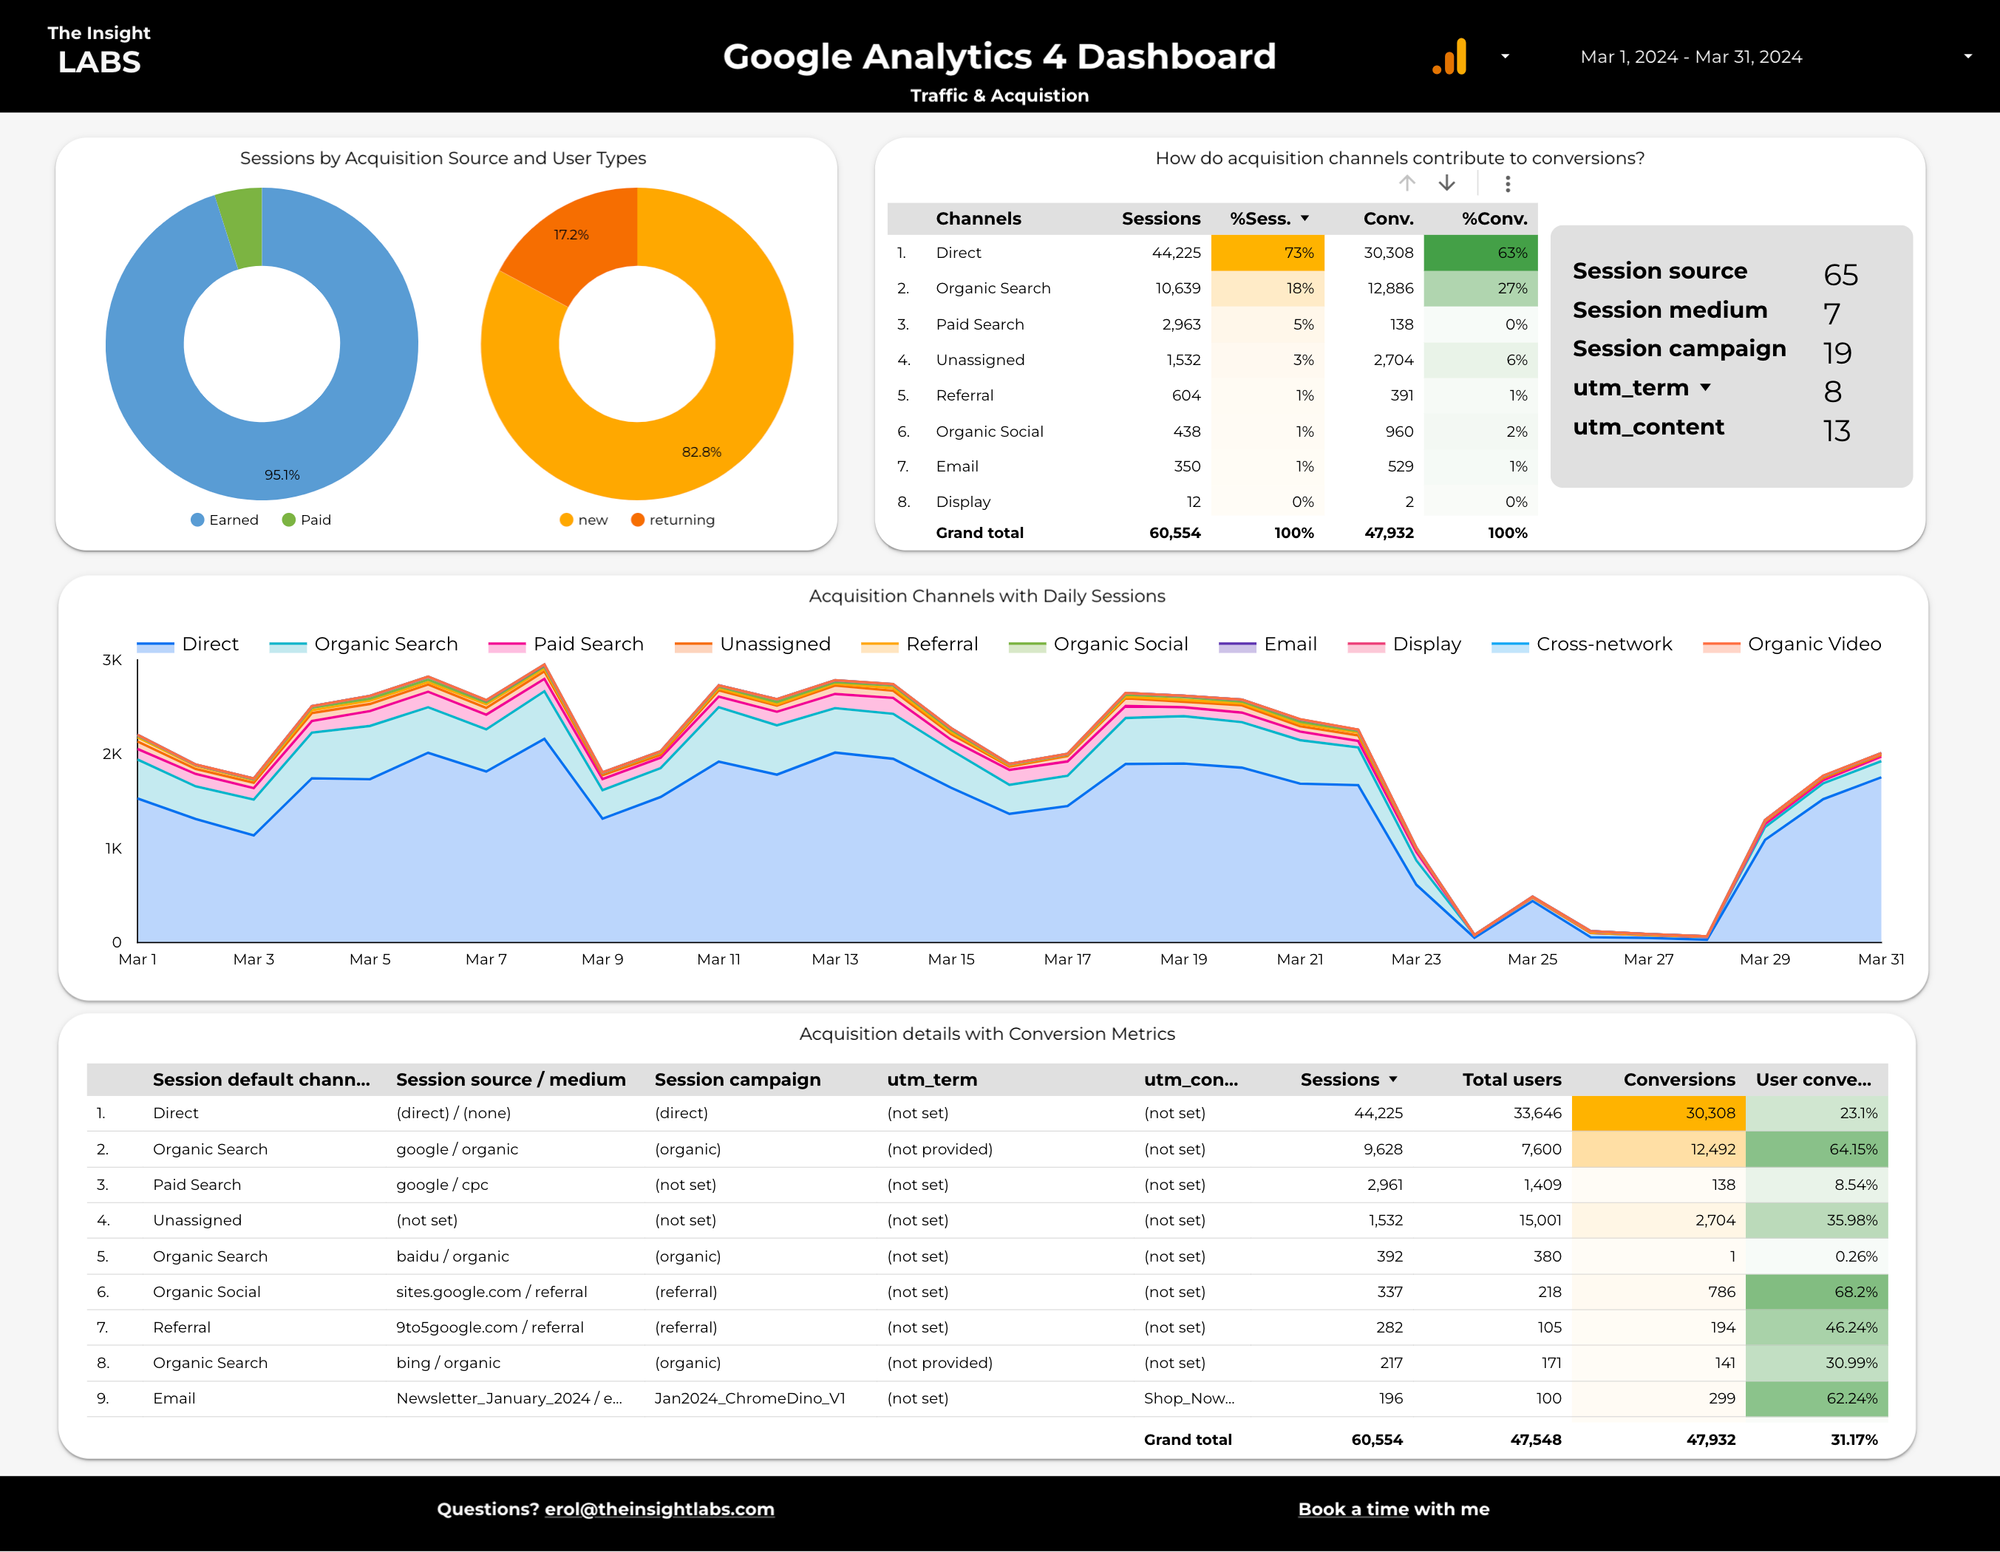
The Traffic and Acquisition report shows daily sessions by channels and groups channels as Earned vs. Paid. Finally, it shows all five UTMs to give you the most detailed campaign analysis possibilities.
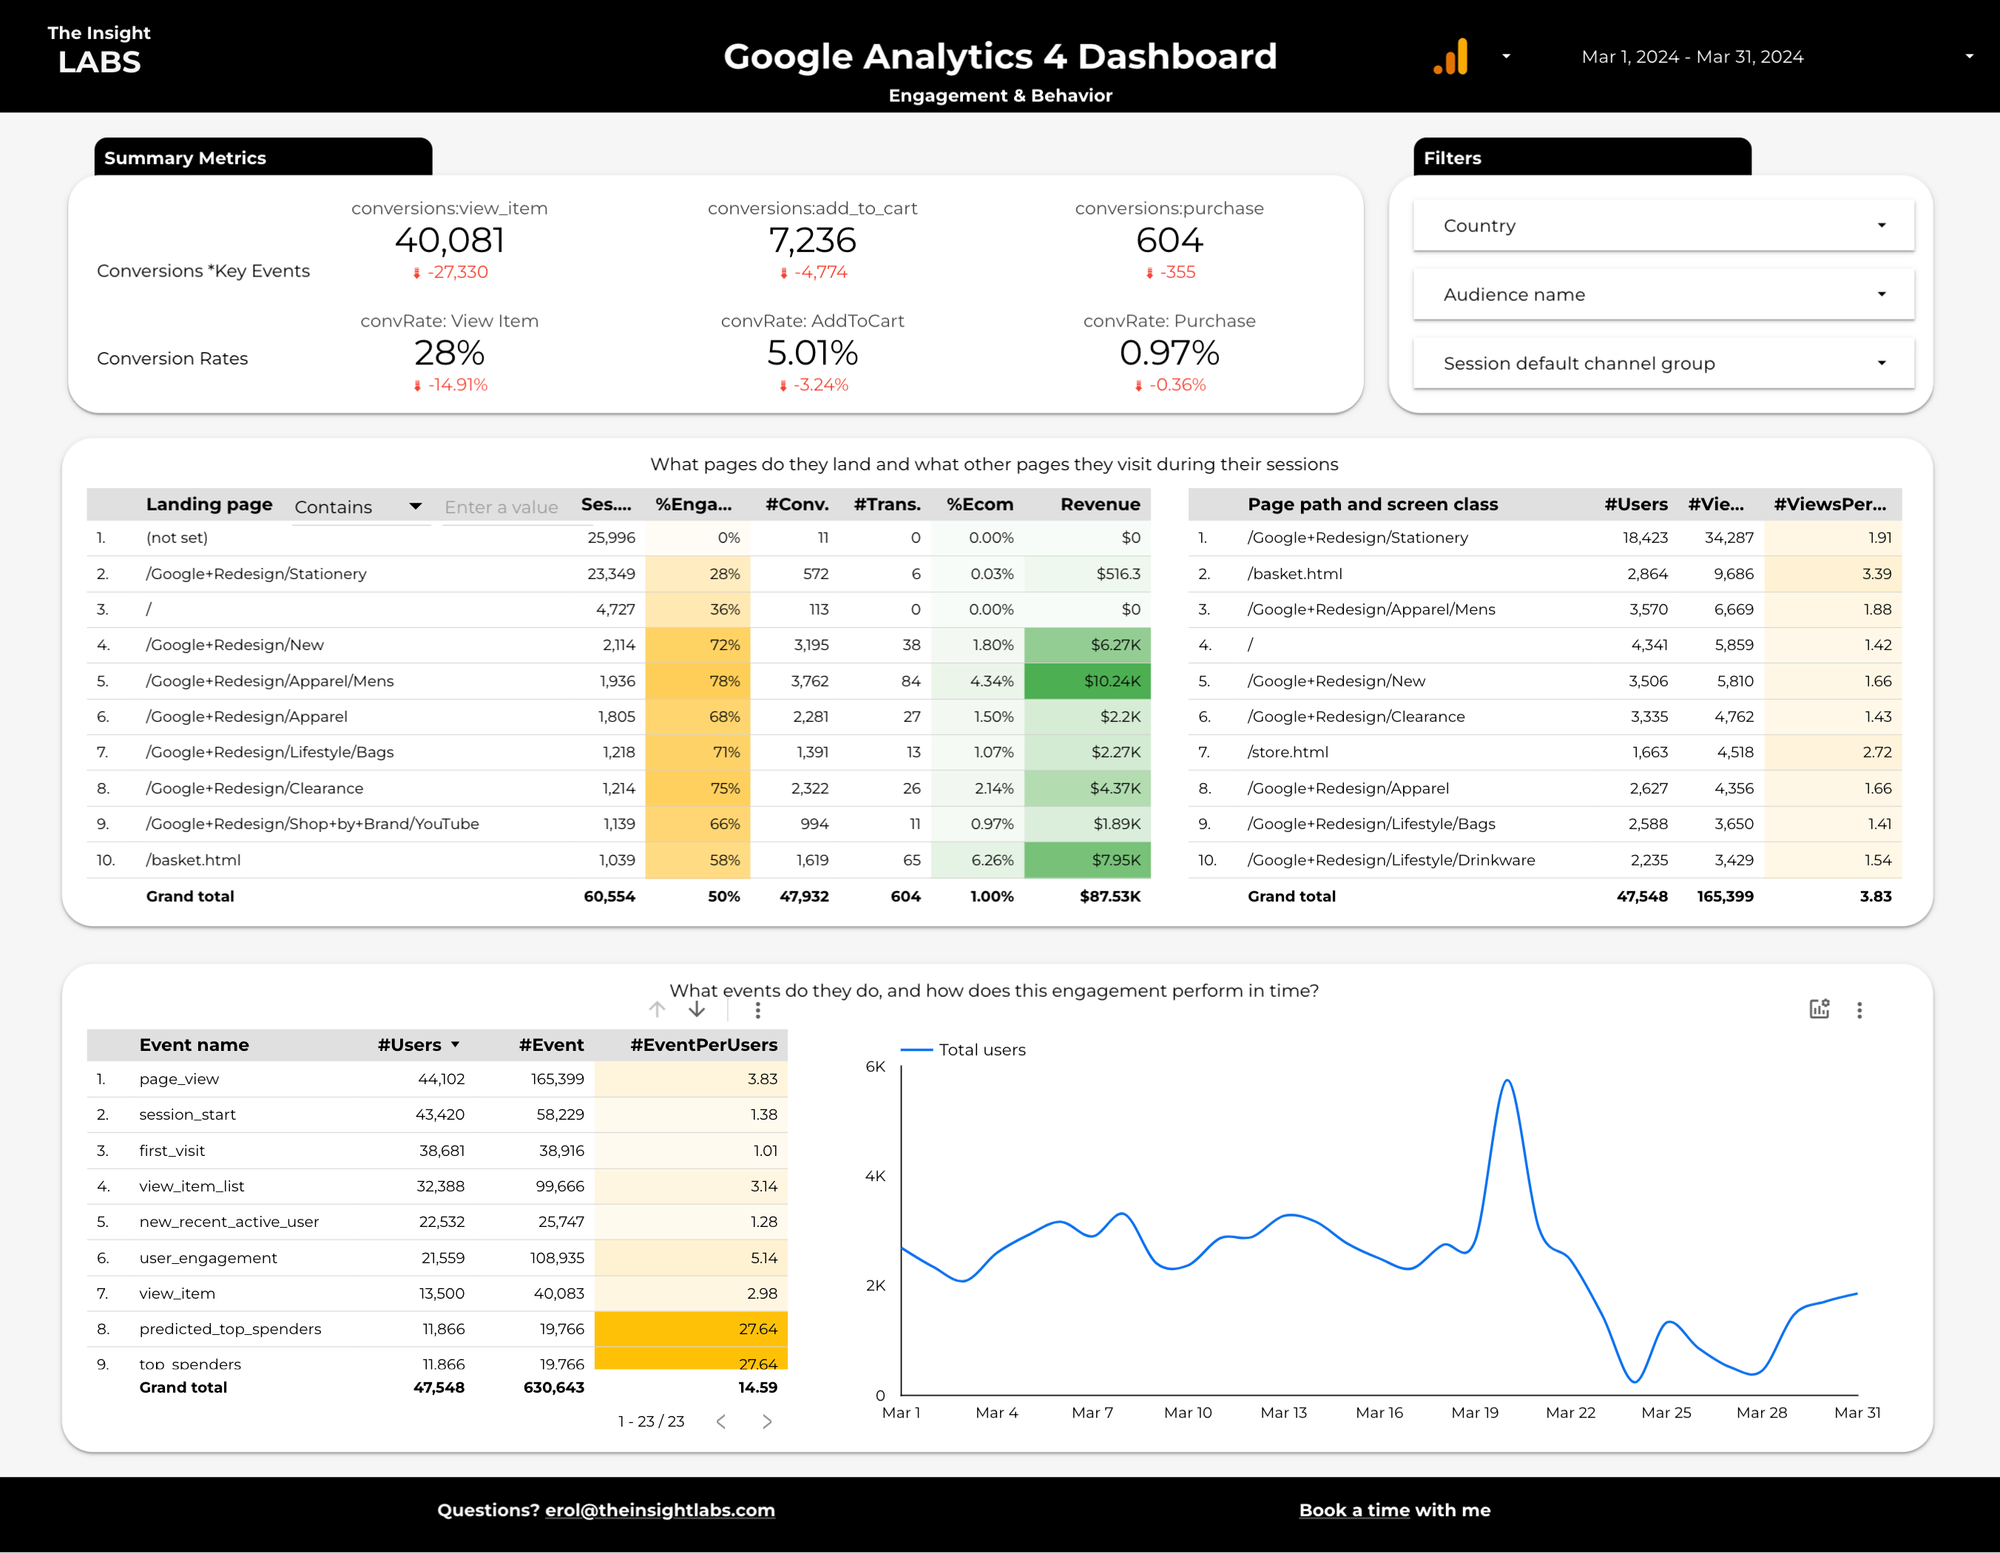
If you have an e-commerce website and your e-commerce settings are correct, you can find product view rates to purchase rates by landing page and all events completed by visitors on the Engagement and Behavior page. Click on the rows of "Landing Page Table," and the Page Path and Screen Class table on the right will show you the other pages the visitors engage during their sessions after landing on the "first" page.
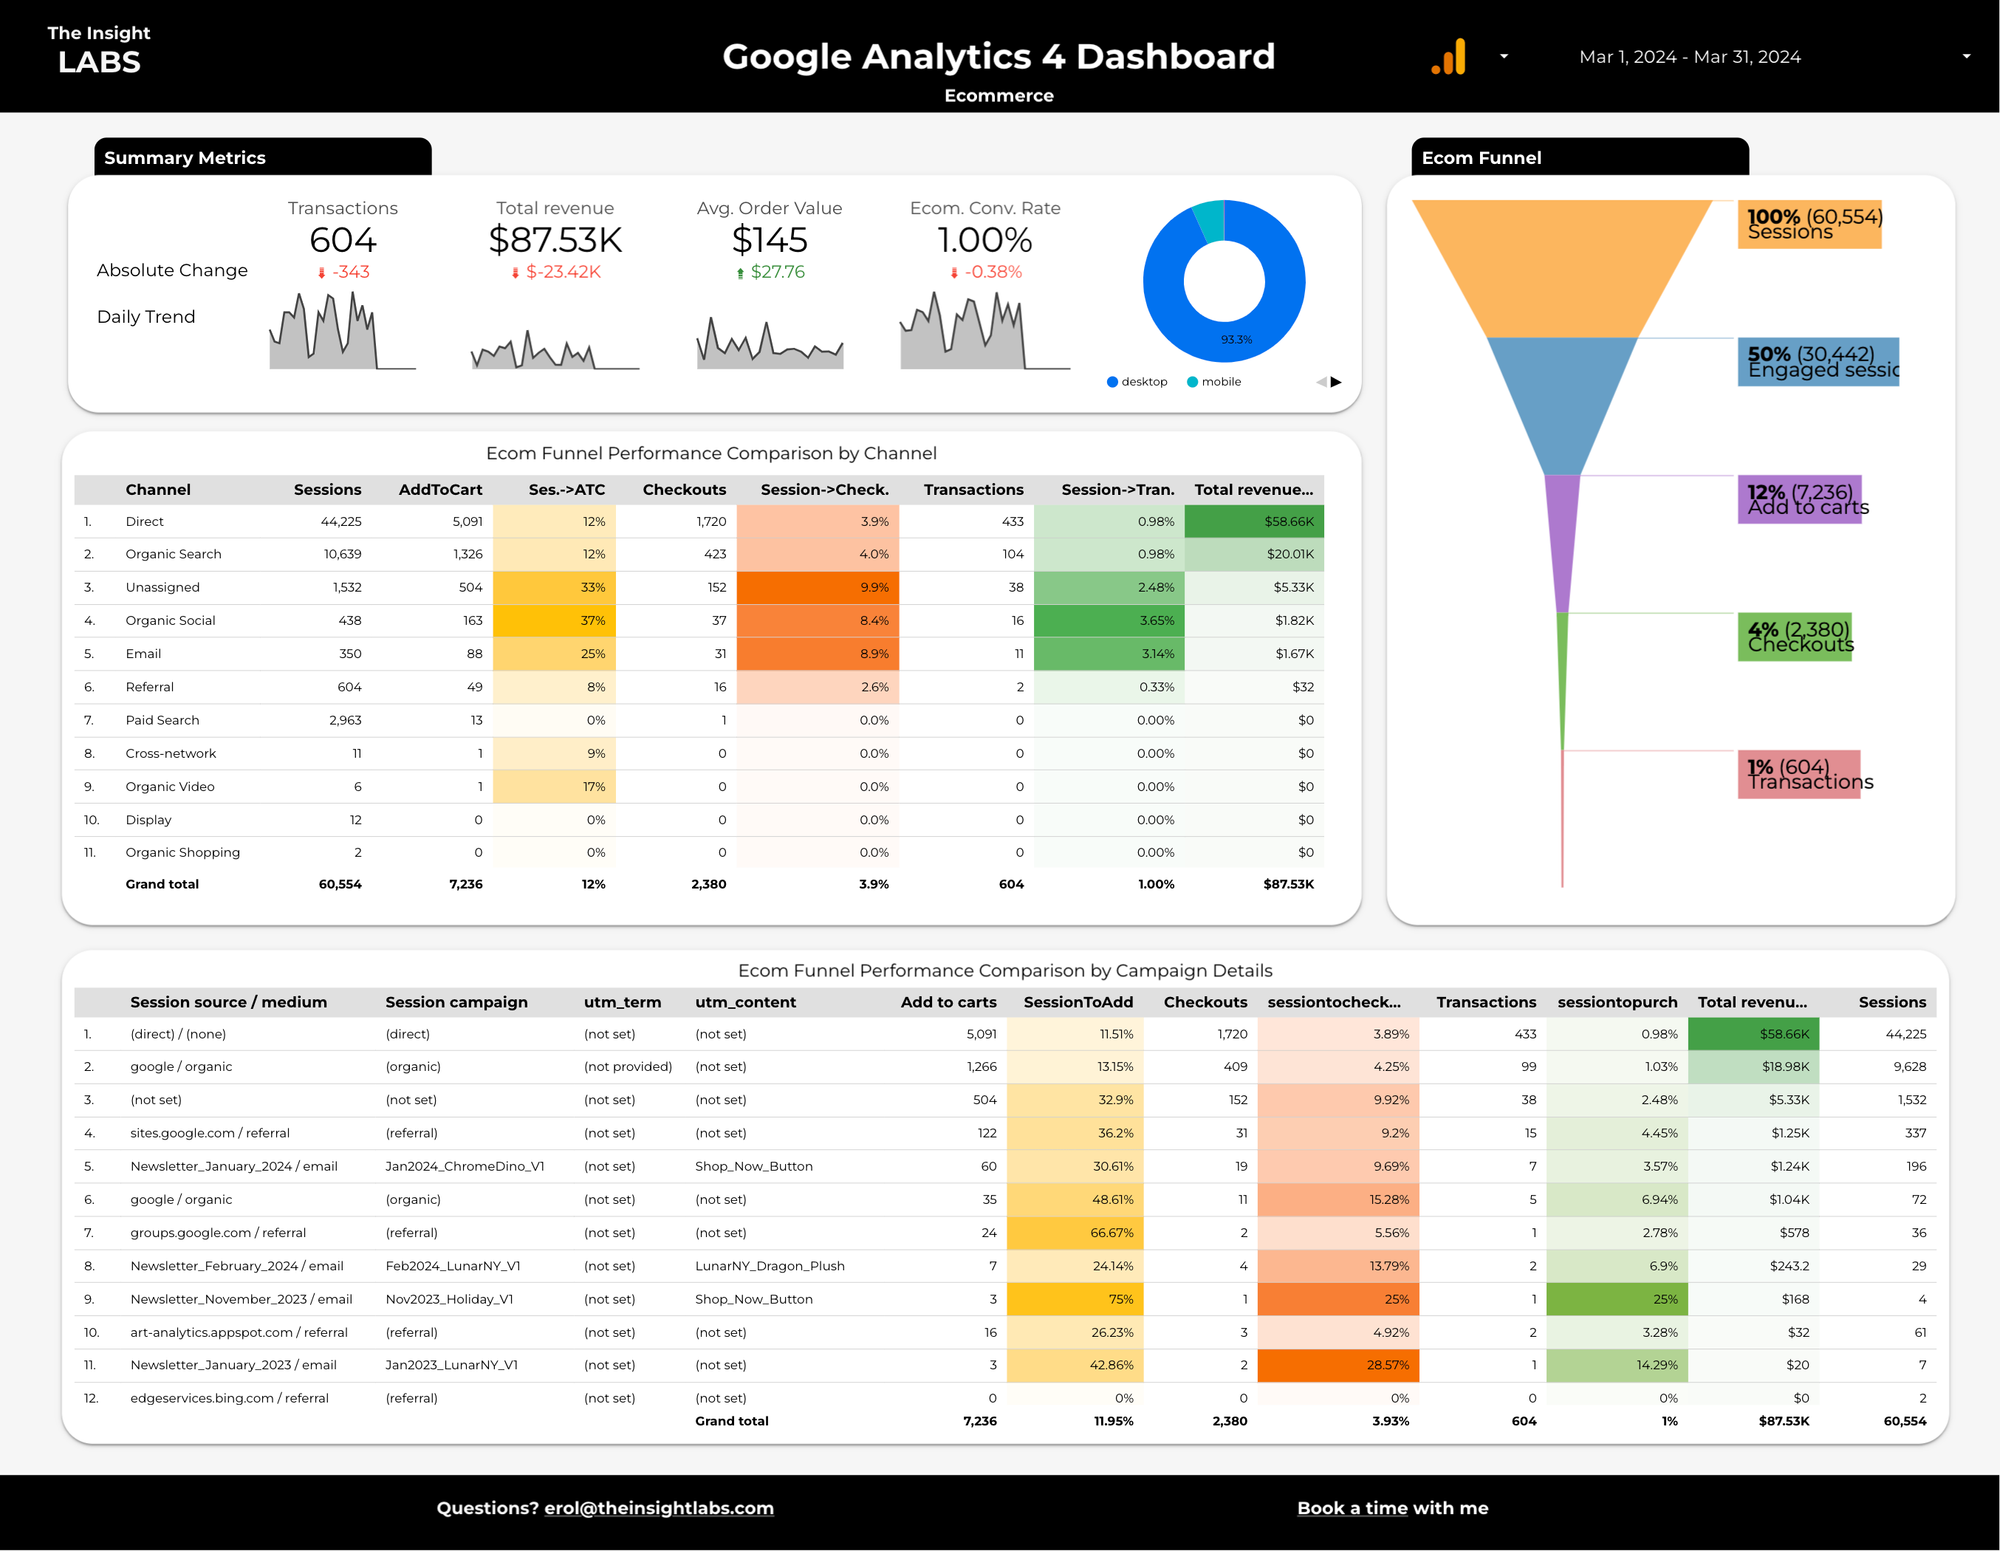
The Ecommerce page shares the Ecom Funnel, and the table in the middle shows the funnel effectiveness by acquisition channels.
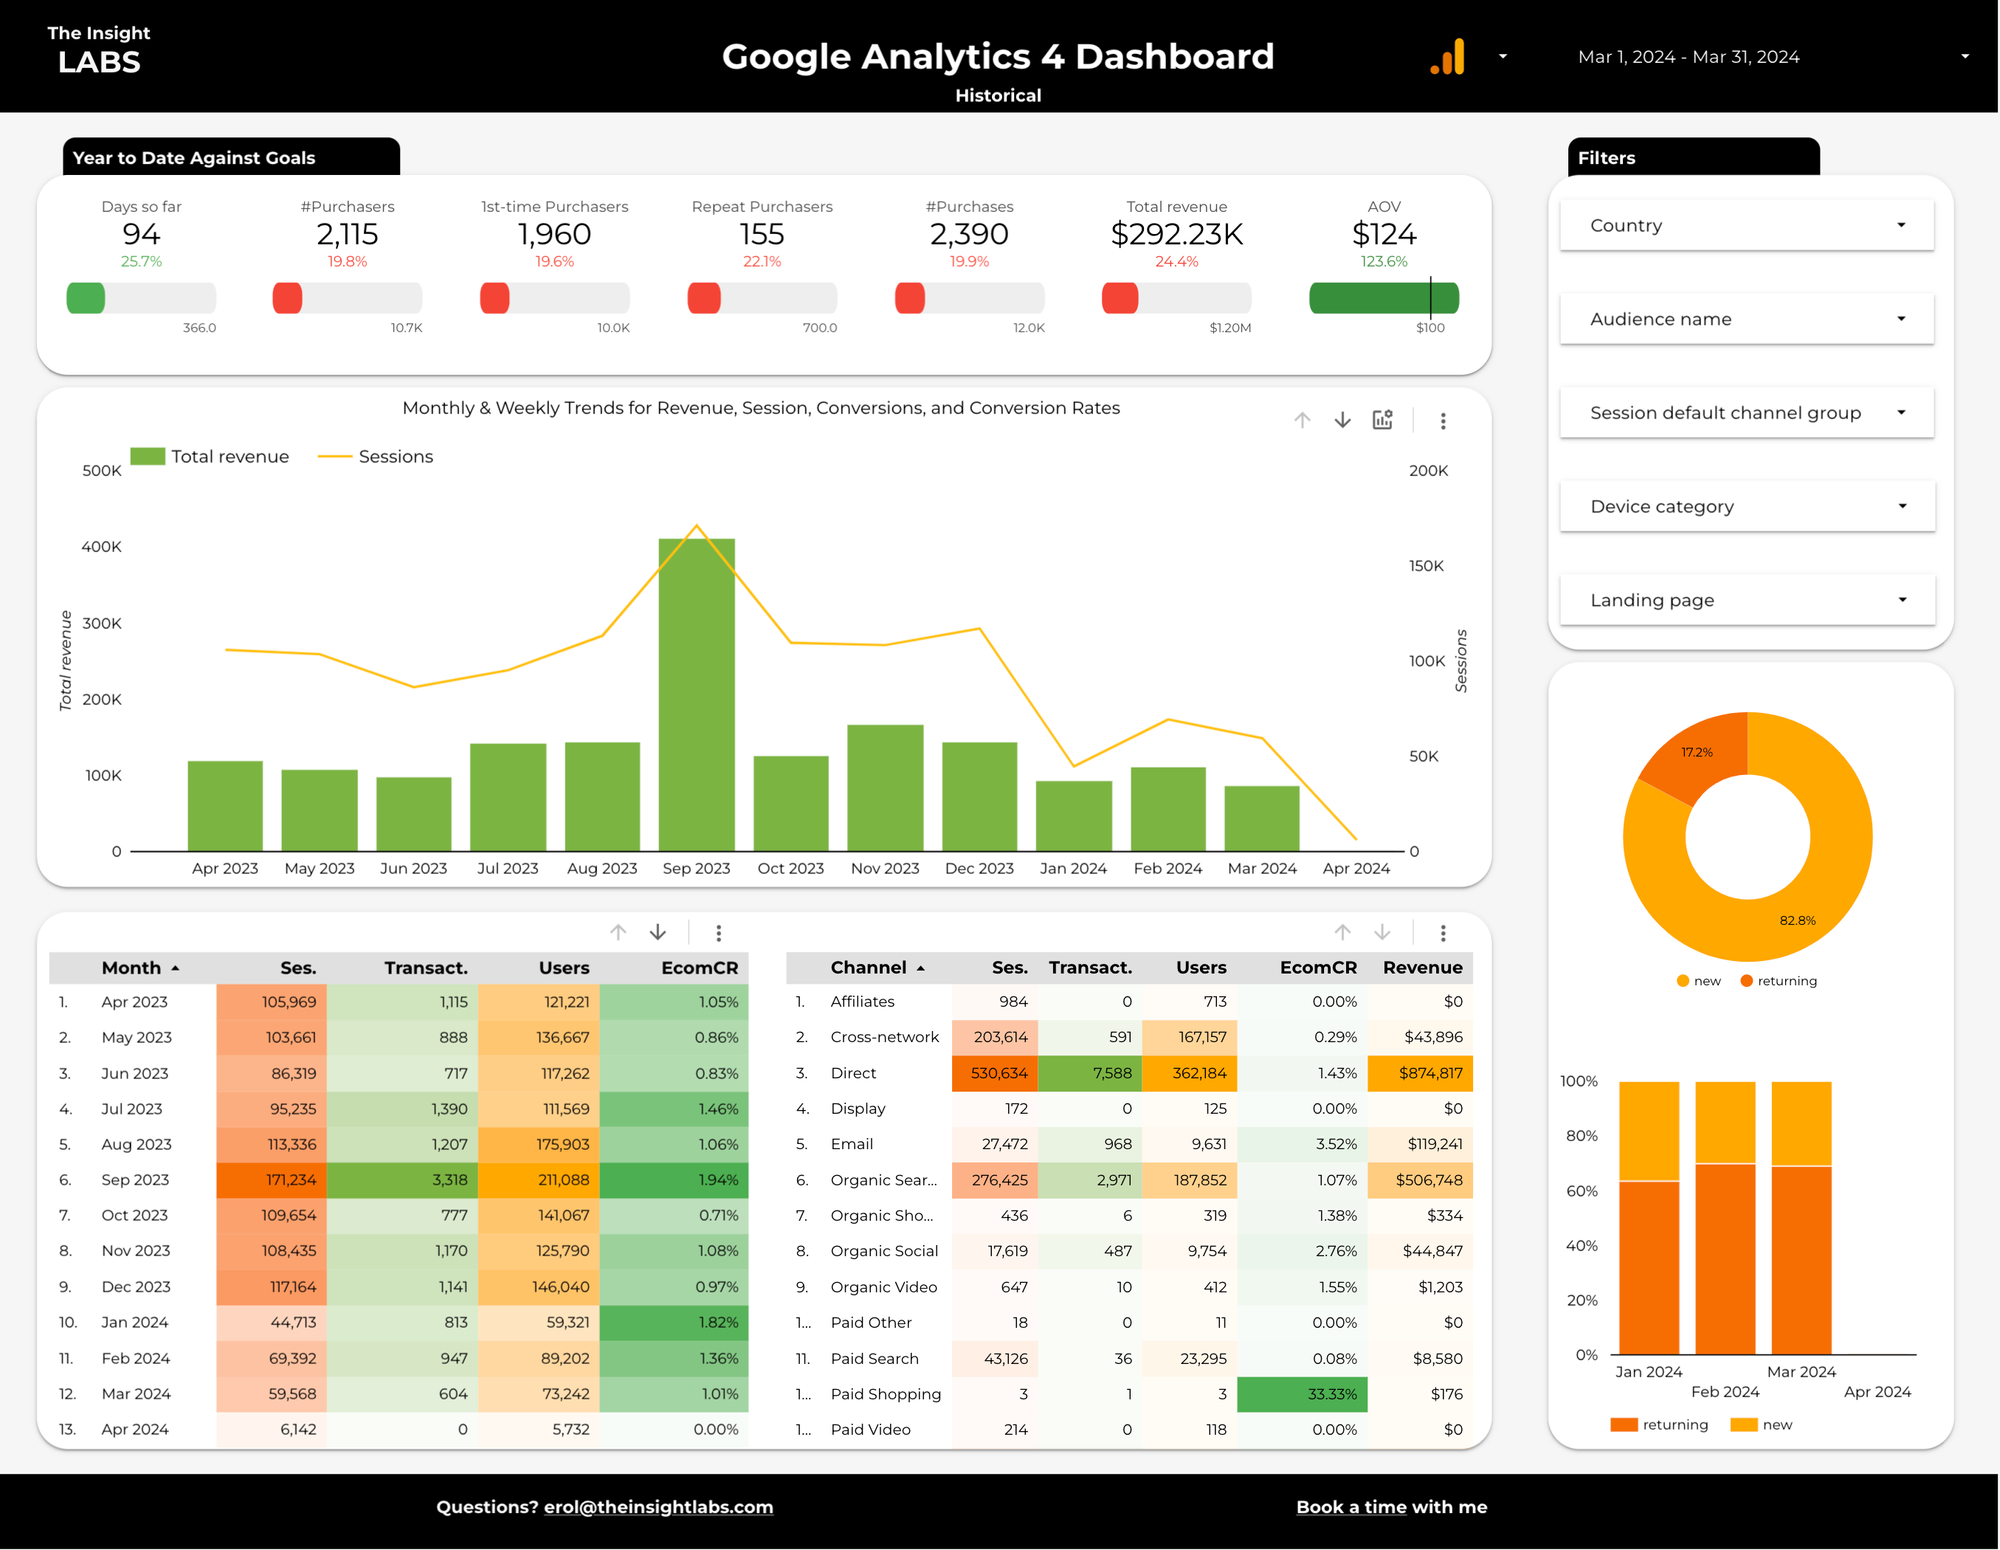
I liked this page. It shows how many days have passed in 2024 so far. The graph in the middle shows the monthly revenue and sessions.
Do you want to use this dashboard with your GA4 data? Here is the lite version for the first page. You can find all the pages below!
First of all, thank you for subscribing to my website! Here, I am trying to provide as much value as possible.
Here is the link to the dashboard! Enjoy, and please let me know if you need additional features.